Cockpit
Beispielanwendung zur Nachahmung eines Flugzeugcockpits mit Graphen.
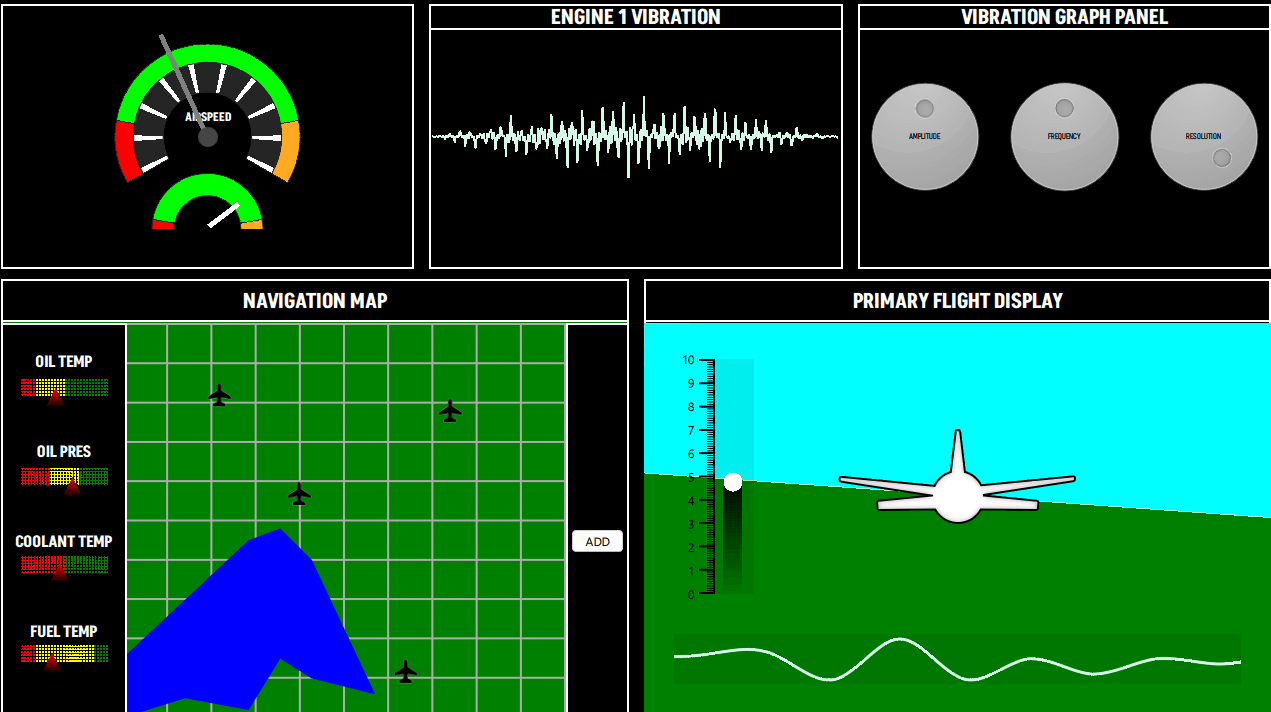
Das Cockpit-Beispiel enthält eine Reihe verschiedener Diagrammtypen, um fiktive Flugzeugsteuerungsbildschirme zu zeichnen. Die in diesem Beispiel verwendeten Graphen sind:
- PieSeries (Geschwindigkeitsmesser)
- LineSeries (Vibrationsanzeige, Navigationskarte)
- AreaSeries (Navigationskarte, Primäre Fluganzeige)
- BarSeries (Navigationskarte, Primäre Fluganzeige)
- ScatterSeries (Navigationskarte)
- SplineSeries (Primäre Fluganzeige)
Ausführen des Beispiels
Zum Ausführen des Beispiels von Qt Creatorzu starten, öffnen Sie den Modus Welcome und wählen Sie das Beispiel aus Examples. Weitere Informationen finden Sie unter Qt Creator: Tutorial: Erstellen und Ausführen.
Geschwindigkeitsmesser
Die Tachometer-Ansicht besteht aus 3 PieSeries in einem einzigen GraphsView mit QML-Rechtecken als Nadeln für beide Tachometer.
Die Eigenschaft backgroundVisible für die GraphsTheme ist auf false eingestellt. Alle PieSlices haben ihre eigenen benutzerdefinierten Farben. Um eine Kreisskala mit einem hohlen Zentrum anzuzeigen, verwendet das Beispiel PieSeries mit unterschiedlicher holeSize.
GraphsView {
    id: chart
    anchors.fill: parent
    anchors.margins: 20

    theme: GraphsTheme {
        backgroundVisible: false
        borderColors: ["#252525"]
    }

    PieSeries {
        id: pieOuter
        pieSize: 1
        holeSize: 0.8
        startAngle: -120
        endAngle: 120

        PieSlice { label: "Stall"; value: 1; color: "#ff0000"; labelVisible: false }
        PieSlice { label: "Optimal"; value: 4; color: "#00ff00"; labelVisible: false }
        PieSlice { label: "Overspeed"; value: 1; color: "#ffaa22"; labelVisible: false }
    }

    PieSeries {
        pieSize: 0.8
        holeSize: 0.6
        startAngle: -120
        endAngle: 120

        PieSlice { value: 1; color: "#ffffff"; }
        PieSlice { value: 4; color: "#252525"; }
        PieSlice { value: 1; color: "#ffffff"; }
        PieSlice { value: 4; color: "#252525"; }
        PieSlice { value: 1; color: "#ffffff"; }
        PieSlice { value: 4; color: "#252525"; }
        PieSlice { value: 1; color: "#ffffff"; }
        PieSlice { value: 4; color: "#252525"; }
        PieSlice { value: 1; color: "#ffffff"; }
        PieSlice { value: 4; color: "#252525"; }
        PieSlice { value: 1; color: "#ffffff"; }
        PieSlice { value: 4; color: "#252525"; }
        PieSlice { value: 1; color: "#ffffff"; }
        PieSlice { value: 4; color: "#252525"; }
        PieSlice { value: 1; color: "#ffffff"; }
        PieSlice { value: 4; color: "#252525"; }
        PieSlice { value: 1; color: "#ffffff"; }
        PieSlice { value: 4; color: "#252525"; }
        PieSlice { value: 1; color: "#ffffff"; }
    }

    PieSeries {
        pieSize: 0.6
        holeSize: 1.0
        startAngle: -120
        endAngle: 120
        verticalPosition: 1

        PieSlice { label: "Stall"; value: 1; color: "#ff0000"; labelVisible: false }
        PieSlice { label: "Optimal"; value: 4; color: "#00ff00"; labelVisible: false  }
        PieSlice { label: "Overspeed"; value: 1; color: "#ffaa22"; labelVisible: false  }
    }
}
Vibrationstafel
Das Vibration Panel enthält eine LineSeries, die zur Laufzeit dynamisch aktualisiert wird. Nach dem Start wird mit der in QML aufgerufenen Funktion append eine Reihe von Punkten zu der Serie hinzugefügt. Bei jedem Frame werden die Werte dann mit der Funktion replace durch berechnete Werte ersetzt. Der Benutzer kann diese Werte über das Vibration Graph Panel ändern.
LineSeries {
    id: line
    property int divisions: 500
    property real amplitude: 0.5
    property real resolution: 0.5

    FrameAnimation {
        running: true

        onTriggered: {
            for (let i = 0; i < line.divisions; ++i) {
                let y = Math.sin(line.resolution*i)
                y *= Math.cos(i)
                y *= Math.sin(i / line.divisions * 3.2) * 3 * line.amplitude * Math.random()

               line.replace(i, (i/line.divisions) * 8.0, y + 4)
            }
        }
    }

    Component.onCompleted: {
        for (let i = 1; i <= divisions; ++i) {
            append((i/divisions) * 8.0, 4.0)
        }
    }

    function change(newDivs) {
        let delta = newDivs - divisions

        if (delta < 0) {
            delta = Math.abs(delta)
            removeMultiple(count - 1 - delta, delta)
        } else {
            for (let i = 0; i < delta; ++i) {
                append(((count + i)/divisions) * 8.0, 4.0)
            }
        }

        divisions = newDivs
    }
}
Schwingungsdiagramm-Panel
Dieses Feld enthält Steuerknöpfe zur Einstellung von Werten, die sich auf die Visualisierung im Schwingungsfeld auswirken.
Navigationskarte
Die Navigationskarte besteht aus zwei Hauptbereichen:
- Der linke Bereich enthält eine Reihe von BarSeries mit einem benutzerdefinierten Shader, der die BarSets Farbe zum Schattieren der einzelnen Balken verwendet.
BarSeries {
    property real barOpacity: 0.

    id: barSeries
    barsType: BarSeries.BarsType.Stacked
    barWidth: 0.2

    barDelegate: Item {
        id: delegate
        antialiasing: true
        property real barOpacity: 0.5
        property color barColor
        property string barLabel

        FrameAnimation {
            running: true
            onTriggered: {
                delegate.barOpacity = Math.abs(Math.sin(elapsedTime))
            }
        }
        ShaderEffect {
            id: effect
            readonly property alias iTime: delegate.barOpacity
            readonly property alias iColor: delegate.barColor
            readonly property vector3d iResolution: Qt.vector3d(width, height, 1.0)

            blending: true
            fragmentShader: 'bar.frag.qsb'
            anchors.fill: parent
        }
    }

    BarSet { id: set1; label: "Low"; values: [1, 2, 3, 1]; color: "red" }
    BarSet { id: set2; label: "Medium"; values: [2, 2, 0, 4]; color: "yellow"}
    BarSet { id: set3; label: "High"; values: [3, 2, 3, 1]; color: "green"}
}
- Der rechte Bereich enthält:
- Ein AreaSeries mit zwei LineSeries visualisiert einen fiktiven See.
- Ein ScatterSeries zeigt darüber hinaus benutzerdefinierte Symbole, z. B. Flughäfen, auf einer Karte an.
- Die Schaltfläche ADD fügt eine LineSeries hinzu, deren Punkte verschoben werden können, um einen Pfad zu erstellen. Dieses LineSeries verwendet einen benutzerdefinierten Shader für das pointDelegate und das ScatterSeries verwendet ein Bild.
AreaSeries {
    property double x: 0
    property double y: 0

    id: lake1
    color: "blue"
    upperSeries: LineSeries {
        id: s1
        XYPoint { x: 0.0; y: -3.5 }
        XYPoint { x: 1.0; y: -5.0 }
        XYPoint { x: 2.0; y: -2.5 }
        XYPoint { x: 2.5; y: -4.0 }
        XYPoint { x: 3.0; y: -4.2 }
    }

    lowerSeries: LineSeries {
        id: s2
        XYPoint { x: 0.0; y: -7.2 }
        XYPoint { x: 1.0; y: -7.0 }
        XYPoint { x: 2.0; y: -8.5 }
        XYPoint { x: 2.5; y: -8.0 }
        XYPoint { x: 3.0; y: -9.0 }
        XYPoint { x: 4.0; y: -6.5 }
    }
}

AreaSeries {
    property double x: 0
    property double y: 0

    id: lake2
    color: "blue"
    upperSeries: LineSeries {
        id: s3
        XYPoint { x: 0.0; y: 1.5 }
        XYPoint { x: 1.0; y: 3.0 }
        XYPoint { x: 2.0; y: 4.5 }
        XYPoint { x: 2.5; y: 4.8 }
        XYPoint { x: 3.0; y: 4.0 }
    }

    lowerSeries: LineSeries {
        id: s4
        XYPoint { x: 0.0; y: 0.0 }
        XYPoint { x: 1.0; y: 0.5 }
        XYPoint { x: 2.0; y: 0.2 }
        XYPoint { x: 2.5; y: 1.5 }
        XYPoint { x: 3.0; y: 1.0 }
        XYPoint { x: 4.0; y: 0.6 }
    }
}

// POI
ScatterSeries {
    name: "Airport"

    pointDelegate: Image {
            source: "airplane-ico.png"
            mipmap: true
            width: 30
            height: 30
    }

    XYPoint{x: 4.0; y: 5.7}
    XYPoint{x: 2.2; y: 8.2}
    XYPoint{x: 6.4; y: 1.2}
    XYPoint{x: 7.4; y: 7.8}
}

LineSeries {
    id: linePath
    selectable: true
    draggable: true
    color: "white"
    pointDelegate: Item {
        width: 50
        height: 50
        property real pointValueX
        property real pointValueY

        FrameAnimation {
            id: scatterAnim
            running: true
        }

        ShaderEffect {
            readonly property vector3d iResolution: Qt.vector3d(width, height, 1.0)
            readonly property alias iTime: scatterAnim.elapsedTime

            blending: true
            fragmentShader: 'circleMarker.frag.qsb'
            anchors.fill: parent
        }

        Text {
            color: "white"
            font.pointSize: 4
            text: "LAT: " + pointValueX.toFixed(1) + ", " + "LON: " + pointValueY.toFixed(1)
        }
    }
}
Primäre Fluganzeige
Die primäre Fluganzeige bietet eine Nachahmung der "3D"-Ansicht des Geländes. Es ist mit zwei AreaSeries implementiert, um den Boden und den Himmel mit jeweils eigenen Farben darzustellen. Eine FrameAnimation aktualisiert die Werte dieser Reihen.
AreaSeries {
    id: upperArea
    color: "cyan"

    upperSeries: LineSeries {
        XYPoint {x: 0; y: 10}
        XYPoint {x: 10; y: 10}
    }

    lowerSeries: LineSeries {
        id: upperLine
        XYPoint {x: 0; y: 3}
        XYPoint {x: 10; y: 4}
    }
}

FrameAnimation {
    running: true
    onTriggered: {
        upperLine.replace(0, upperLine.at(0).x, Math.sin(elapsedTime) + 6)
        upperLine.replace(1, upperLine.at(1).x, Math.cos(elapsedTime) + 6)
        lowerLine.replace(0, lowerLine.at(0).x, Math.sin(elapsedTime) + 6)
        lowerLine.replace(1, lowerLine.at(1).x, Math.cos(elapsedTime) + 6)
        barSet.values = [Math.sin(elapsedTime) + 5]
    }
}
Auf der linken Seite zeigt ein thematisches BarSeries die Beschriftung der y-Achse an. Dieses BarSeries verwendet auch einen benutzerdefinierten Shader für den Balken.
BarSeries {
    id: barSeries
    selectable: true
    barDelegate: Item {
        id: delegate
        antialiasing: true
        property real barOpacity: 0.5
        property color barColor
        property string barLabel

        ShaderEffect {
            id: effect
            readonly property vector3d iResolution: Qt.vector3d(width, height, 1.0)

            blending: true
            fragmentShader: 'pitchbar.frag.qsb'
            anchors.fill: parent
        }
    }

    BarSet { id: barSet; values: []; selectedColor: "red" }
}
Am unteren Rand der Ansicht visualisiert ein SplineSeries die Geländehöhe unter dem Flugzeug. Die SplineSeries wird bei jedem Frame aktualisiert. Der Code, der die Serie aktualisiert, fügt hinten eine kontinuierliche Serie von Punkten hinzu und entfernt sie vorne. Wenn der Mauszeiger über der SplineSeries schwebt, wird ein Tooltip angezeigt, der den Wert der y-Achse (Höhe) anzeigt.
GraphsView {
    anchors.fill: parent
    anchors.leftMargin: -90
    anchors.rightMargin: -80
    anchors.bottomMargin: -30

    theme: GraphsTheme {
        backgroundVisible: false
        plotAreaBackgroundColor: "#11000000"
    }

    axisX: ValueAxis {
        max: 10
        subTickCount: 9
        lineVisible: false
        gridVisible: false
        subGridVisible: false
        labelsVisible: false
        visible: false
    }

    axisY: ValueAxis {
        max: 10
        subTickCount: 9
        lineVisible: false
        gridVisible: false
        subGridVisible: false
        labelsVisible: false
        visible: false
    }

    ToolTip {
        id: tooltip
    }

    onHoverEnter: {
        tooltip.visible = true;
    }

    onHoverExit: {
        tooltip.visible = false;
    }

    onHover: (seriesName, position, value) => {
                 tooltip.x = position.x + 1;
                 tooltip.y = position.y + 1;
                 tooltip.text = "Altitude: " + (value.y * 1000).toFixed(1) + "m";
             }

    FrameAnimation {
        property var points: []

        Component.onCompleted: {
            for (let i = 0; i < altitudeLine.count; ++i) {
                points[i] = altitudeLine.at(i)
            }
        }

        running: true
        onTriggered: {
            for (let i = 0; i < points.length; ++i) {
                points[i].x -= frameTime

                if (points[1].x <= -2) {
                    let p = points[0]
                    p.x = points[points.length - 1].x + 1
                    altitudeLine.append(p)
                    altitudeLine.remove(0)

                    points.length = 0

                    for (let i = 0; i < altitudeLine.count; ++i) {
                        points[i] = altitudeLine.at(i)
                    }
                }
            }
            altitudeLine.replace(points)
            altitudeLine.update()
        }
    }

    SplineSeries {
        id: altitudeLine
        hoverable: true
        width: 3

        XYPoint {x: 0; y: 5}
        XYPoint {x: 1; y: 2}
        XYPoint {x: 2; y: 5}
        XYPoint {x: 3; y: 4}
        XYPoint {x: 4; y: 6}
        XYPoint {x: 5; y: 7}
        XYPoint {x: 6; y: 9}
        XYPoint {x: 7; y: 8}
        XYPoint {x: 8; y: 9}
        XYPoint {x: 9; y: 6}
        XYPoint {x: 10; y: 6}
        XYPoint {x: 11; y: 6}
        XYPoint {x: 12; y: 1}
        XYPoint {x: 13; y: 9}
        XYPoint {x: 14; y: 1}
    }

}
© 2026 The Qt Company Ltd. Documentation contributions included herein are the copyrights of their respective owners. The documentation provided herein is licensed under the terms of the GNU Free Documentation License version 1.3 as published by the Free Software Foundation. Qt and respective logos are trademarks of The Qt Company Ltd. in Finland and/or other countries worldwide. All other trademarks are property of their respective owners.
