
5.9.7. Architecture Pipeline Execution
The Architecture Pipeline is a sequence of actions that are run as part of the Axivion
Continuous Integration. Starting from the
intermediate representation (IR) extracted from the source code of the system under
analysis, the first pipeline action Architecture-Dependencies creates the RFG
representation of the system. The subsequent pipeline actions then process the RFG
further. Each pipeline action can transform the RFG in arbitrary ways. A pipeline run
can also start from an RFG, in which case the first pipeline action is skipped.
The pipeline is set up by configuring the Architecture group in the project configuration.
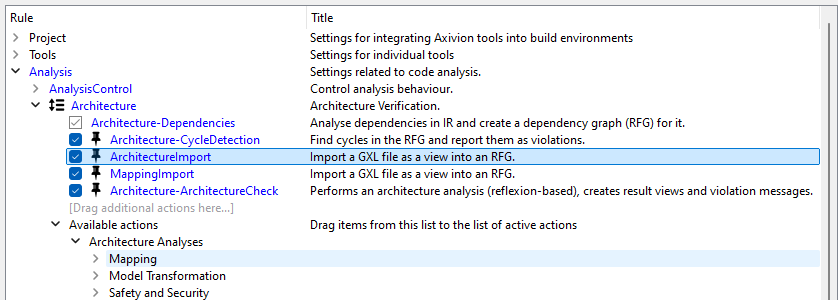
The architecture pipeline in the Configuration UI
Debugging the architecture pipeline is difficult because there is no easy way to check
the intermediate state of the RFG when the pipeline is executed as part of a Continuous
Integration run. To make debugging easier Gravis has special support for viewing
and executing the architecture pipeline. To open the pipeline in Gravis, choose

Edit → 
Architecture pipeline....
This opens the Pipeline Setup dialog.
5.9.7.1. The Pipeline Setup dialog
The most important thing to set up is the pipeline configuration. As usual, this is
defined by a list of configuration files as found in the BAUHAUS_CONFIG
variable. You can either set up the full contents of this variable using the system
path separator to separate multiple entries, or just enter the name of a single
configuration file. In the latter case, you can use the Browse... button
to select it.
Even if your configuration consists of multiple files, it is enough to pick the
file containing the settings for the Architecture
group, but you may just as well pick an interface layer that includes this file. For
most projects, this would be called axivion_config.json.
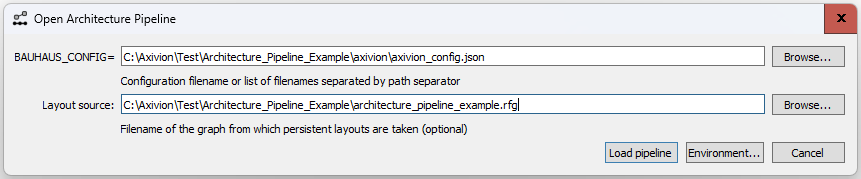
The Pipeline Setup dialog
The layout source graph
The main point of architecture pipeline execution in Gravis is to examine
intermediate states of the RFG at certain points in the pipeline. When these states are
shown in Gravis, they are loaded from temporary files and therefore, they have no
associated persistent layouts. If you would like
to use the persistent layouts of an existing graph you can enter the filename of an RFG
file into the Layout source field or click on the Browse...
button next to it to select a file. Then, copies of this graph’s persistent layouts are
available when examining the output of pipeline execution runs. If you do not have an
existing graph with persistent layouts, simply leave the field empty.
Environment variables
Some configurations reference environment variables. In that case, these can be set up
by clicking on Environment.... This is an optional step.
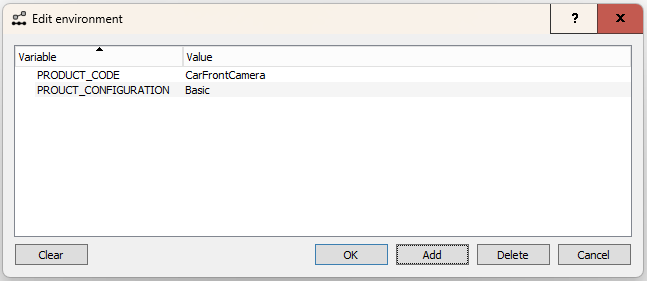
The Edit Environment window
In the Edit Environment window, new variable definitions can be added by clicking on
Add. Selected entries can be deleted by clicking on Delete.
Clicking on Clear clears all entries. Click on OK to accept
the entered definitions and return to the Setup dialog.
Finally, click on Load pipeline to load the configuration. If there are no
errors, this will open the Architecture Pipeline window.
5.9.7.2. The Architecture Pipeline window
The Architecture Pipeline window shows the configured pipeline steps and a few buttons to control pipeline execution.
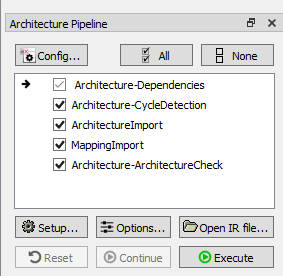
The Architecture Pipeline window
This window shows a very simple pipeline setup with five steps. The first step
Architecture-Dependencies is always present, the remaining four steps are custom
steps retrieved from the configuration. Each custom step has a checkbox that allows you
to control whether the step should be executed. Clicking on
All/None enables/disables all custom steps.
Hovering the mouse pointer over an entry opens a tooltip with a summary of the item’s
configuration as a quick reference. To get a better view or to edit the configuration,
click on the Config... button, which opens the configuration GUI axivion_config.
After editing and saving the configuration in the GUI, Gravis alerts you that the configuration has changed and offers to reload it. This is always a good idea to avoid looking at outdated information. Pipeline execution will always use the latest state of the configuration files.
After reloading the configuration, newly added pipeline steps are shown with a green background.
You can adapt the pipeline configuration at any point by clicking on
Setup..., which opens the Pipeline Setup dialog again,
allowing you to adapt the environment settings or even load a completely different
pipeline.
Note
Changing the pipeline configuration loses any existing execution state and resets the pipeline window.
Pipeline Options
Clicking on Options... opens the Pipeline Options dialog:
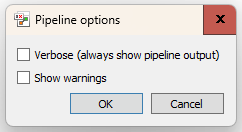
The Pipeline Options dialog
By default, the output from pipeline execution is only shown if there is an error. If
you enable Show warnings, then warning messages are shown in an extra
window. If you enable Verbose (always show pipeline output), then the full
output is shown after each pipeline execution.
Loading an IR file
There are two ways to execute the architecture pipeline: either starting from an IR file
or starting from an RFG file. Starting from an RFG file is straightforward: simply load
it using File → 
Open.... However, a suitable RFG
file is not readily available. Of course, you can download an RFG file from the
Dashboard, but this RFG file is the final output from
Continuous Integration, so it represents the state after executing the Architecture
Pipeline.
To create an RFG file that represents the state at the beginning of the Architecture
Pipeline, download the IR file from the Dashboard, then click on the
Open IR file... button in the Architecture Pipeline window and select it.
That executes the first pipeline step Architecture-Dependencies with the
configured options and leaves you with a loaded RFG file that is suitable as a base RFG
for executing the pipeline. It might be a good idea to save this file.
Executing the Architecture Pipeline
Having obtained a base RFG by loading either an IR file or an RFG file, you are ready to execute the pipeline.
Clicking on Execute records the current state of the RFG as the base
graph for pipeline execution and starts the pipeline.
While executing the pipeline, the step that is being executed is marked with a yellow background, finished items are marked with a green background. Only items that are ticked are executed. There is some initial setup time before the first item is marked as being executed because it takes time to record the base graph and launch the pipeline process in the background. This is particularly noticeable if the RFG is large because this involves saving the current state of the RFG in Gravis.
If there is an error, the item that caused it is marked with a red background and a window shows the complete output from the execution.
If there was no error, Gravis shows you the final state of the RFG at the end of
the pipeline and the Execute button label turns into
Restart (see Restarting the pipeline).
In the View Box, new views added by pipeline steps are highlighted with a green background and modified views are highlighted with an orange background.
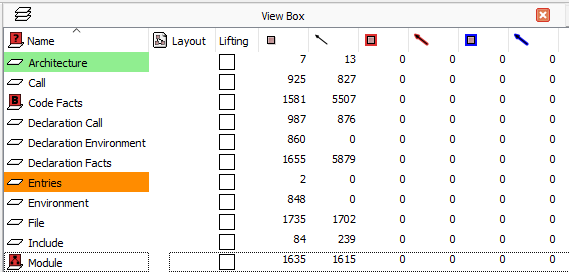
Highlighted views after executing the pipeline.
Note
By default, Gravis checks for modified views in a very basic way: just by looking at the number of nodes and edges in the graph. You can make this much more accurate by changing the Gravis configuration, at the expense of slower pipeline execution.
Setting breakpoints
You can set breakpoints like in a debugger by clicking to the left of an item. A red blob appears to indicate that there is a breakpoint. Clicking again clears the breakpoint. Pipeline execution stops before executing an item with a breakpoint and lets you examine the state of the RFG right before executing the given item.
When execution is stopped at a breakpoint the execution pointer ( )
indicates the next item to be executed.
)
indicates the next item to be executed.
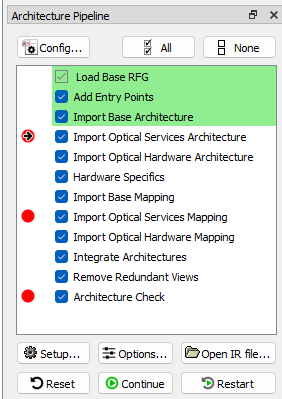
Stopped at a breakpoint.
In this example, steps Load Base RFG, Add Entry Points, and
Import Base Architecture were executed successfully and execution stopped just
before executing Import Optical Services Architecture.
Views that were added or changed by completed steps are marked with a colored background as described above.
Clicking on Continue resumes execution from the current state of the RFG.
That means that you are able to adapt the RFG before clicking on Continue
to try what would happen if the RFG was different.
Restarting the pipeline
Clicking on the Restart button re-runs the pipeline starting from the base
graph that was recorded when Execute was clicked. That is useful to
revisit an earlier breakpoint, after setting different breakpoints or after changing the
configuration.
Resetting the pipeline
To modify the base graph from which pipeline execution starts, click on
Reset. This loads the recorded base graph and allows you to modify it.
Clicking on the Execute button records the current state as the new base
graph and re-runs the pipeline.
5.9.7.3. Ending a pipeline execution session
To end the pipeline execution session, simply close the Architecture Pipeline window.