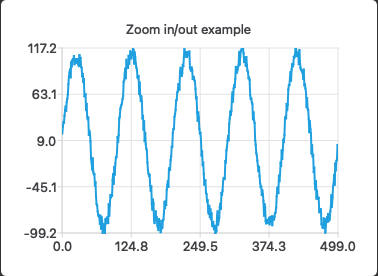
Zoom Line Chart Example
The example shows how to create a zoomable simple sinusoidal line chart.

# Copyright (C) 2024 The Qt Company Ltd.
# SPDX-License-Identifier: LicenseRef-Qt-Commercial OR BSD-3-Clause
from PySide6.QtWidgets import QGesture, QGestureEvent
from PySide6.QtCore import Qt, QEvent
from PySide6.QtCharts import QChart


class Chart(QChart):
    def __init__(self,
                 ChartType=QChart.ChartType.ChartTypeCartesian,
                 QGraphicsItem=None,
                 WindowType=Qt.WindowFlags):
        super().__init__()

        self.grabGesture(Qt.PanGesture)
        self.grabGesture(Qt.PinchGesture)

    def sceneEvent(self, event: QEvent):

        if event.type() == QEvent.Gesture:
            return self.gestureEvent(event)

        return super().sceneEvent(event)

    def gestureEvent(self, event: QGestureEvent):

        if gesture := event.gesture(Qt.PanGesture):
            pan = gesture
            self.scroll(-pan.delta().x(), pan.delta().y())

        if gesture := event.gesture(Qt.PinchGesture):
            pinch = gesture

            if pinch.changeFlags() & QGesture.QPinchGesture.ScaleFactorChanged:
                self.zoom(pinch.scaleFactor())

        return True
# Copyright (C) 2024 The Qt Company Ltd.
# SPDX-License-Identifier: LicenseRef-Qt-Commercial OR BSD-3-Clause
from PySide6.QtCharts import QChart, QChartView
from PySide6.QtGui import QKeyEvent, QMouseEvent
from PySide6.QtCore import QEvent, Qt
from PySide6.QtWidgets import QGraphicsView


class ChartView(QChartView):
    def __init__(self, chart, parent=None):
        super().__init__(chart, parent)

        self.setRubberBand(QChartView.RectangleRubberBand)
        self._isTouching = False

    def viewPortEvent(self, event: QEvent):

        if event.type() == QMouseEvent.TouchBegin:
            self._isTouching = True

            self.chart().setAnimationOptions(QChart.NoAnimation)

        return super().viewPortEvent(event)

    def mousePressEvent(self, event: QMouseEvent):

        if self._isTouching:
            return

        return super().mousePressEvent(event)

    def mouseMoveEvent(self, event: QMouseEvent):

        if self._isTouching:
            return

        return super().mouseMoveEvent(event)

    def mouseReleaseEvent(self, event: QMouseEvent):

        if self._isTouching:
            self._isTouching = False

        self.chart().setAnimationOptions(QChart.SeriesAnimations)

        return super().mouseReleaseEvent(event)

    def keyPressEvent(self, event: QKeyEvent):

        key = event.key()
        if key == Qt.Key_Plus:
            self.chart().zoomIn()

        elif key == Qt.Key_Minus:
            self.chart().zoomOut()

        elif key == Qt.Key_Left:
            self.chart().scroll(-10, 0)

        elif key == Qt.Key_Right:
            self.chart().scroll(10, 0)

        elif key == Qt.Key_Up:
            self.chart().scroll(0, 10)

        elif key == Qt.Key_Down:
            self.chart().scroll(0, -10)

        else:
            QGraphicsView.keyPressEvent(event)
# Copyright (C) 2024 The Qt Company Ltd.
# SPDX-License-Identifier: LicenseRef-Qt-Commercial OR BSD-3-Clause
import sys
import math
from PySide6.QtWidgets import QApplication, QMainWindow
from PySide6.QtCore import Qt, QPointF, QRandomGenerator
from PySide6.QtCharts import QChart, QLineSeries
from PySide6.QtGui import QPainter

import chartview
import chart

if __name__ == "__main__":

    app = QApplication(sys.argv)

    series = QLineSeries()

    points = [
        QPointF(float(i), math.sin(math.pi / 50 * i) * 100 + QRandomGenerator.global_().bounded(20))
        for i in range(500)]

    series.append(points)

    line_chart = chart.Chart()
    line_chart.addSeries(series)
    line_chart.setTitle("Zoom in/out example")
    line_chart.setAnimationOptions(QChart.SeriesAnimations)
    line_chart.legend().hide()
    line_chart.createDefaultAxes()

    chart_view = chartview.ChartView(line_chart)
    chart_view.setRenderHint(QPainter.Antialiasing, True)

    window = QMainWindow()
    window.setCentralWidget(chart_view)
    window.resize(400, 300)
    window.grabGesture(Qt.PanGesture)
    window.grabGesture(Qt.PinchGesture)
    window.show()

    sys.exit(app.exec())