Matplotlib Widget Gaussian Example
A Python application that demonstrates how to interact with matplotlib and scipy, combined with Qt Widgets.
# Copyright (C) 2022 The Qt Company Ltd.
# SPDX-License-Identifier: LicenseRef-Qt-Commercial OR BSD-3-Clause
from __future__ import annotations
import sys
import numpy as np
from scipy.stats import norm
from matplotlib.figure import Figure
from matplotlib.backends.backend_qtagg import FigureCanvas
from matplotlib.backends.backend_qtagg import NavigationToolbar2QT
from PySide6.QtCore import Slot
from PySide6.QtWidgets import (
QApplication,
QWidget,
QDoubleSpinBox,
QVBoxLayout,
QHBoxLayout,
)
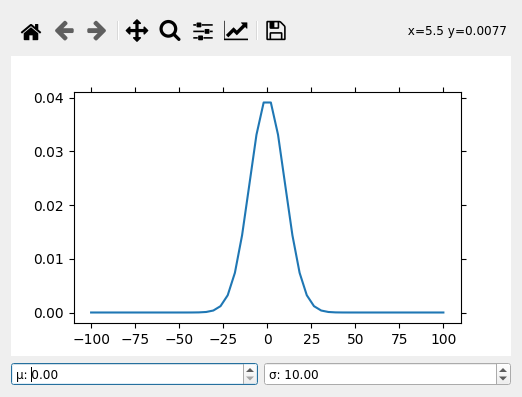
"""This example implements the interaction between Qt Widgets and a 2D
matplotlib plot showing a gaussian curve with scipy"""
class PlotWidget(QWidget):
def __init__(self, parent=None):
super().__init__(parent)
# create widgets
self.view = FigureCanvas(Figure(figsize=(5, 3)))
self.axes = self.view.figure.subplots()
self.toolbar = NavigationToolbar2QT(self.view, self)
self.mu_input = QDoubleSpinBox()
self.std_input = QDoubleSpinBox()
self.mu_input.setPrefix("μ: ")
self.std_input.setPrefix("σ: ")
self.std_input.setValue(10)
# Create layout
input_layout = QHBoxLayout()
input_layout.addWidget(self.mu_input)
input_layout.addWidget(self.std_input)
vlayout = QVBoxLayout()
vlayout.addWidget(self.toolbar)
vlayout.addWidget(self.view)
vlayout.addLayout(input_layout)
self.setLayout(vlayout)
# connect inputs with on_change method
self.mu_input.valueChanged.connect(self.on_change)
self.std_input.valueChanged.connect(self.on_change)
self.on_change()
@Slot()
def on_change(self):
""" Update the plot with the current input values """
mu = self.mu_input.value()
std = self.std_input.value()
x = np.linspace(-100, 100)
y = norm.pdf(x, mu, std)
self.axes.clear()
self.axes.plot(x, y)
self.view.draw()
if __name__ == "__main__":
app = QApplication(sys.argv)
w = PlotWidget()
w.show()
sys.exit(app.exec())