
5.1.2.2. Projects
This section is about the connection between axivion_ci and the Dashboard, i.e. how analysis results are made available inside the Dashboard via artifacts. Please refer to Project Configuration about information on how to create these artifacts.
Dashboard Project configuration is done on the “Projects” page,
see The project list configuration view, from within the
Dashboard. You require the Configure Dashboard
permission, in order to see the
navigation entry in the navigation bar’s settings menu.
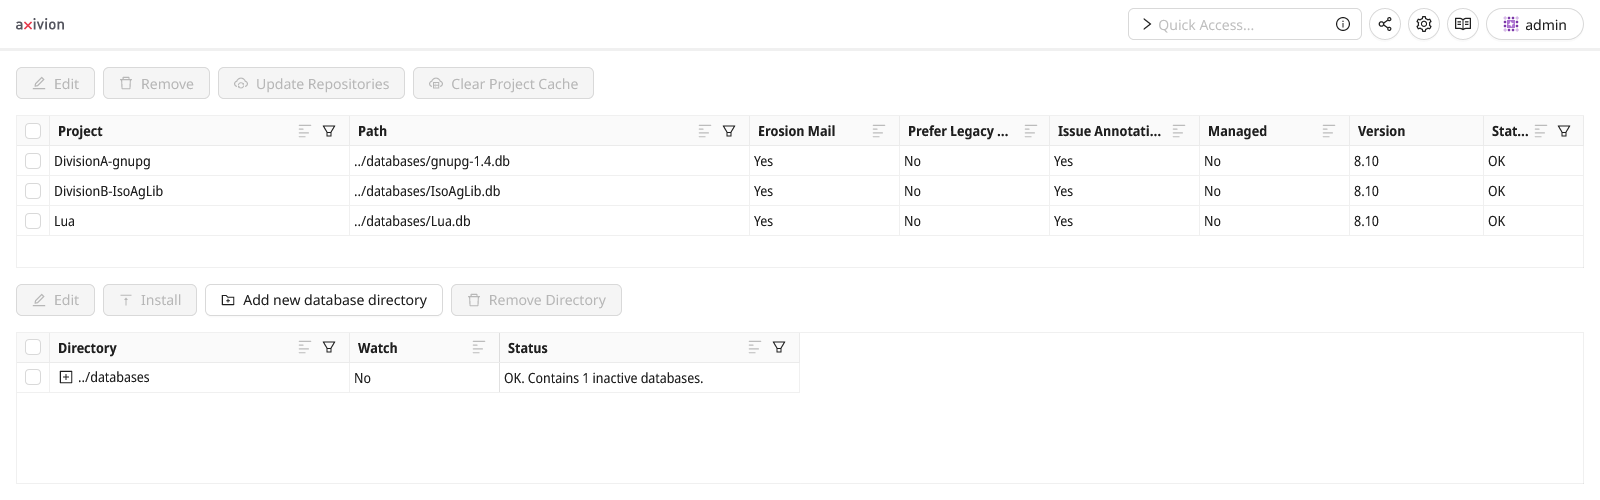
The project list configuration view
Project Artifacts
Artifacts are files containing analysis results and annotations. There are currently
five types:
.db– the project database containing versioned Erosion Issues and Metrics.shadoworshadow.fossil– database containing generated files.rfg– Resource Flow Graph (e.g., used for Architecture, CycleDetection, and DeadcodeDetection).ir– Intermediate Representation (e.g., used for CloneDetection, Metrics, and Stylechecks).dbx– stores Issue Annotations like tags and comments
The first four artifacts are created by axivion_ci while the
.dbx is created by the Dashboard.
Note
Mirror repositories needed by some Version Control Systems in order for the Dashboard
to be able to display source code are not considered artifacts in this context, as
they are very often shared between several projects.
Project Types
There are two types of projects that only differ in the way their so-called
artifacts are managed / installed to the Dashboard. From a usage point-of-view the
two project types are completely identical. The Dashboard can handle a mixture of
projects of both types at the same time. The types are:
Manually managed (default) – Artifacts are managed in filesystem by an administrator and typically reside on a network fileshare when axivion_ci and Dashboard run on different hosts
Automatically managed – This was introduced with 7.6.0 and basically eliminates the need for manual artifact management and installation. See here and here for reading about how to enable the feature and its current limitations
Projects with database mode “managed upload”
Projects with database_mode configured to managed_upload
were introduced with 7.6.0 and basically
eliminate the need for manual artifact management
and installation as it is necessary for
shared_database
projects. See here for reading about how
to enable the feature and its current limitations.
To delete such projects the Remove button can be used.
While for automatically managed projects this will delete the
artifacts from the disk permanently, for
shared_database
projects it will simply unregister them from the dashboard configuration. Whether the
artifacts of a project are managed_upload or shared_database is
indicated by the
Managed column of the upper projects list.
All artifacts of automatically managed projects
reside in one, non-configurable, dedicated folder called artifacts inside the
Dashboard configuration folder.
Caution
Please do not manually work with the files inside the artifacts folder.
If you are tempted to manually work with the files in this folder, it is likely you
are in one of the
use-cases not yet supported
by this feature.
axivion_ci Authentication
In order for axivion_ci to have the permission to download and upload project artifacts we recommend the following steps:
Create an authentication token:
In the Dashboard Server: Create a dedicated user (e.g., builduser) for automation tasks (if you haven’t done so already).
Give that user the permissions
Log InandUpdate Analysis Artifacts.Go to the user’s personal page (click on its name in user-management).
Create an authentication token of type
Continuous Integrationand give it a useful description. For example:builduser token used by axivion_ci to access the Dashboard stored in our automation server.
Configure the Token in your Automation Server:
Automation systems usually have methods for storing credentials that you should use to store the username and token.
Configure your automation system such that the environment variable
AXIVION_USERNAMEis set to the username andAXIVION_PASSWORDto the token whenaxivion_ciis invoked.Depending on your security requirements there are simpler but less secure methods for passing the credentials to
axivion_ci.
In the Automation-Server Jenkins, this could look like the following:
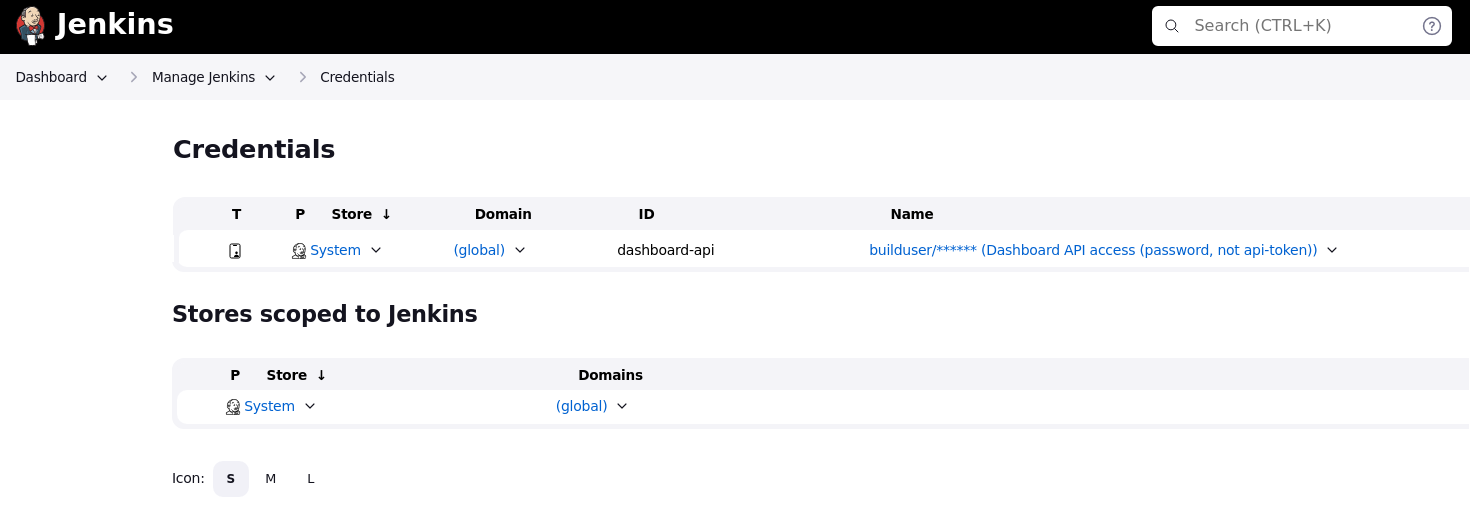
Jenkins Credentials Storage Example
Applying the credentials in the Jenkins Automation Server in a groovy pipeline script could look like the following:
withCredentials([usernamePassword(
        credentialsId: 'dashboard-api',
        usernameVariable: 'AXIVION_USERNAME',
        passwordVariable: 'AXIVION_PASSWORD',
)]) {
    bat """
        set "BAUHAUS_CONFIG=%CD%\\Axivion"
        axivion_ci
    """
}
Classic Jenkins-Jobs can achieve the same via UI configuration.
List of Active Projects
In the upper list you can configure your active projects or remove them again.
By selecting one or more projects and then clicking the Edit button a new
window opens which shows you all configuration options possible for the selected set
of projects.
Caution
If you change a project name you have to adjust the projectname input in
your analysis configuration accordingly so the Continuous Integration can refer to
the project correctly, e.g. when triggering
Erosion Notification Emails
Note
Quite some aspects in the dashboard can be configured on a project group basis using *-patterns. So consider grouping your projects by giving similar projects similar prefixes or suffixes
If the Dashboard integrated
Erosion Notification System
is enabled, you will see the column Erosion Emails.
It allows you to disable notifications on a per-project basis.
Enable Issue Annotations is another configurable column where you
explicitly disable the Issue Annotations Feature. Consider doing this for preventing
users from putting work in commenting and annotating issues that you will later throw
away because you are still experimenting with your setup.
The Managed column indicates whether the
artifacts of a project are
shared_database or
managed_upload.
The Version column gives you a hint on what internal schema version a
database is at. The analysis data schema version numbers are different from the
Axivion Suite version numbers.
Caution
Although you can migrate databases to newer versions explicitly via cidbman migrate we recommend doing this only for historical databases where there is no Continuous Integration running any more because the Axivion Suite version used for analyzing might be older than the Axivion Suite version used for running the dashboard. Analysis runs will automatically upgrade the schema version and it is best to leave this task to them.
The project list gives you further possibilities you usually don’t need like clearing cached data for the project in order to refresh the version list or updating the version control system cache. If the dashboard is running during analysis and properly known to the Continuous Integration, the cache updates will happen automatically.
Project Hierarchies
You can define hierarchies of projects for the Dashboard Page
by naming them accordingly. The project name has to be prefixed with the groups it belongs to
separated by one of the characters configured via the option Project Name Separators in
General Settings
(underscore (_), hyphen (-), and dot (.) by default).
For example the projects TeamA-ProjectX-master and TeamA-ProjectX-feature will create
a tree with the root TeamA that contains the group ProjectX that in turn contains the
projects master and feature.
Note
A group cannot be a project, i.e. a project name must not be a prefix of another one. A group name must not be empty, i.e. separators must not be leading or trailing or occur consecutively.
FAQ
Q: Why was my project automatically deleted?
A: Axivion projects are associated with specific Git branches. If a branch no longer exists in the remote repository, the project is marked for automatic cleanup (if enabled).
Solution: Verify that your project configuration reflects a valid Git branch name, not “HEAD” or a detached state. Do not override the branch detection unless necessary.
Recovery: If your project was deleted:
Create a database directory and register it as an “unmanaged database directory” in Settings → Projects
Place the trashed database file there (removing the
.trashsuffix)Enable the project via Settings → Projects
Run a managed upload analysis to make it a managed project again
Q: Why are Git clones consuming disk space in my database directory?
A: The sourceserver_gitdir configuration creates one Git clone per Axivion project, which is inefficient.
Solution: In version 7.8+, remove the sourceserver_gitdir setting. Axivion
will automatically detect the repository and create a single shared clone instead of
one per project:
Remove
sourceserver_gitdirfrom the Git configurationThe next analysis will create a shared clone in the new location
Once all projects are updated, you can remove the old project-specific clones
Dashboard: When using database_mode=managed_upload (formerly upload=true),
you also get automatic cleanup of old databases when Automatic Project Cleanup is enabled
in Settings → General.
Q: Why aren’t outdated projects being cleaned up automatically?
A: Automatic Project Cleanup is configured in Dashboard Settings → General and consists of two independent phases, each with its own opt-in checkboxes. Both phases run periodically every 24 hours.
Phase 1 - Trashing projects (files renamed with a .trash suffix, not yet
permanently deleted):
Trash Active Projects- trashes installed (managed_uploadandshared_database) projects whose associated Git branch no longer exists in the remoteTrash Inactive Projects- trashes uninstalled (shared_databaseonly) projects whose branch no longer exists
Phase 2 - Permanently deleting trashed projects (irreversible):
Delete *.trash files from shared_database projectsDelete *.trash files from managed_upload projects
You can enable Phase 1 without Phase 2 (to review before permanent deletion), or enable both to fully automate cleanup.