
5.1.4.5. Issue Details
The Issue View can be opened from various
places,
most notably from the Issue Table
but also from other Issue Views and
File Views, via the issue kind icons.
The Issue View displays the source location(s) of an issue along with its (their)
surroundings, as well as other meta information about the issue. Among the meta
information are things like affected architectural components, affected entities, a
short error description and so on. There is also a chart, highlighting on a linear time
axis, in what version ranges the displayed issue has been active and you can add tags
and comments to the issue.
In the section above the code viewer there is a version slider which lets you view the issue in different versions of your source code. In case you selected a version where the issue does not exist you will still get to see the source code where the issue was spotted last and also the details it had when it existed. This is useful for reviewing how exactly an issue has been resolved. You will notice that you are viewing an issue where it does not exist anymore by the red colored analysis version dates in the sidebar. Also you will not see any current issue being highlighted in the source code, only the usual grey highlighting for other issues.
Furthermore, the code viewer itself hosts a toolbar that helps you adjust the settings of the code viewer and interact with the file content. These are identical to those available in the File View. The toolbar includes a find button to help you search the file content – which is equivalent to pressing Ctrl + F once the code viewer has focus –, a button to download the currently displayed file, a button to open the file for editing and a settings buttons to fine-tune the appearance of the code viewer to your specific needs.
In case you have the necessary permission for the current project you can see issue owner information in the issue details on the right. It will be highlighted in red if more than one user is responsible for the given issue.
In the tabular meta information on the right there is also a small pencil icon alongside every issue location that lets you open the file containing that location in your favorite editor.
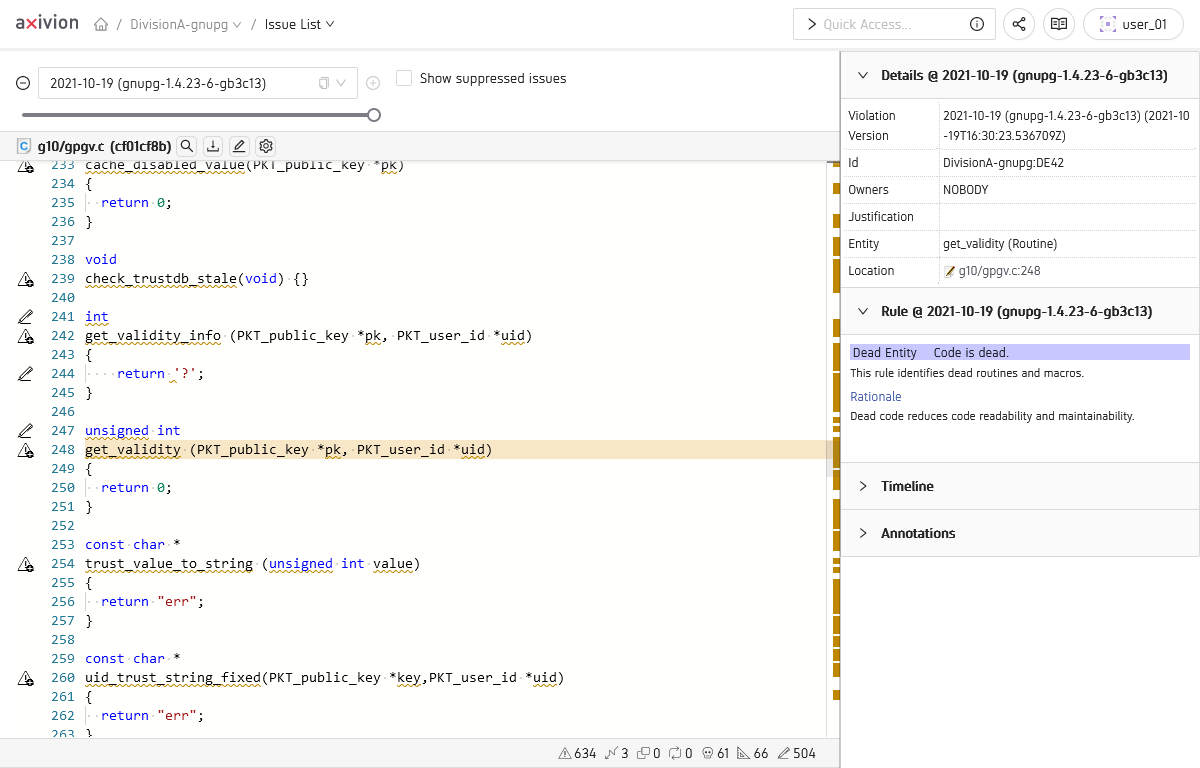
IssueView showing a Dead Entity  

The manner in which the source code is displayed is basically the same as in the File View, however the code location affected by the issue will be highlighted in an eye-catching color. You can also choose a different version. If you choose a version where the issue does not exist, nothing can be highlighted, but the Issue View still tries to give you at least the same file. Keep in mind, that this is not possible if the file does not exist in the selected version. You can also quickly jump to a specific line by using the Ctrl+G shortcut.
Depending on the issue the presentation of the issue will vary.
Architecture Violations  ,
Clones
,
Clones  and Cyclic Dependencies
  usually will be presented
with two adjacent code windows
showing two involved snippets side-by-side.
Here
you can see a Clone and that the highlighting marks the
cloned areas as well as
the differences between the two similar code fragments.
usually will be presented
with two adjacent code windows
showing two involved snippets side-by-side.
Here
you can see a Clone and that the highlighting marks the
cloned areas as well as
the differences between the two similar code fragments.
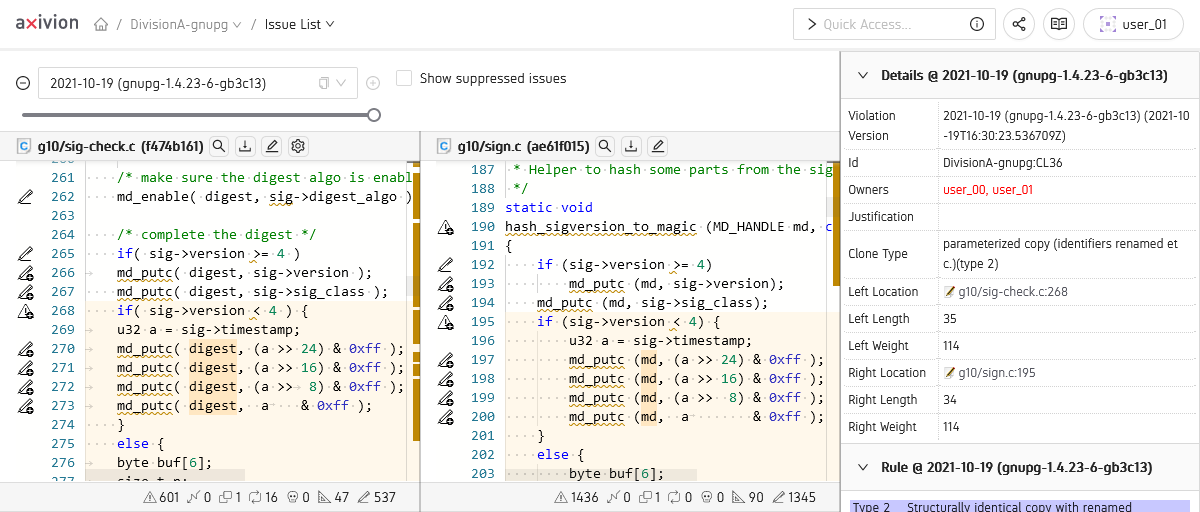
Issue View showing a Clone 
Visualizations / Preview Images
For some Issue Kinds, currently
Architecture Violations and
Cyclic Dependencies ,
we offer visualizations to help in getting
a better understanding of the issue.
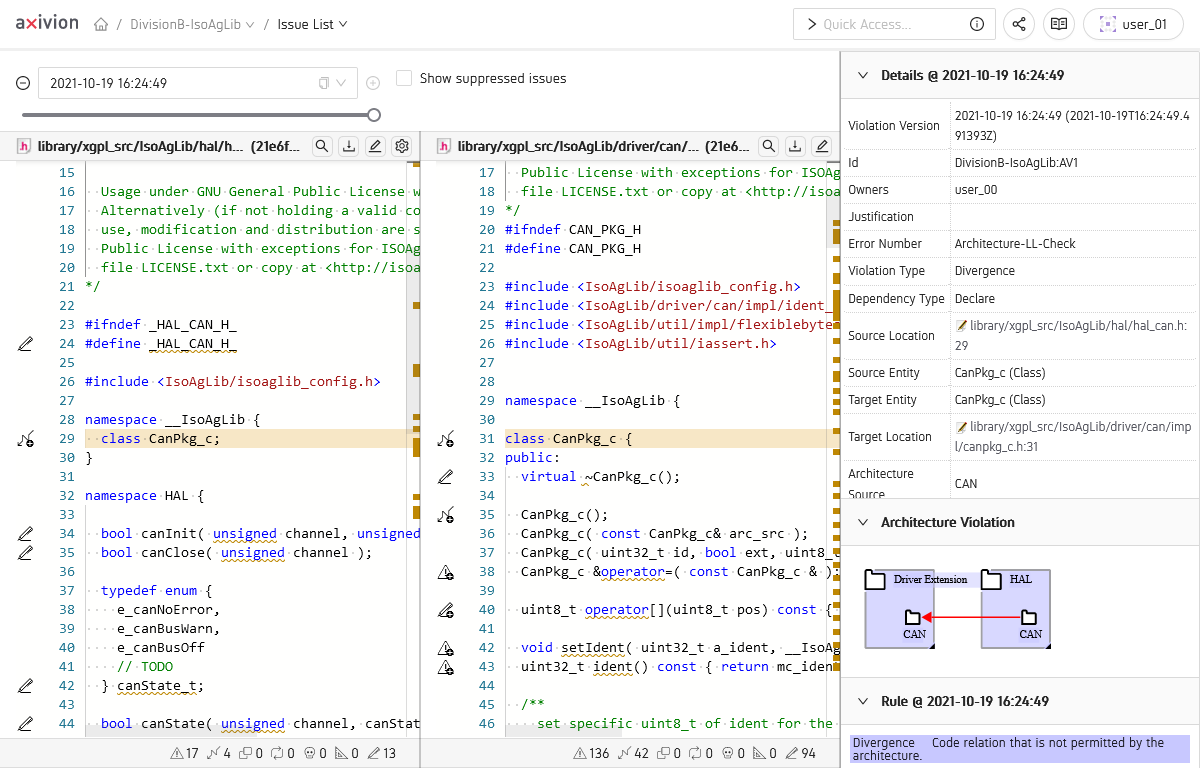
Issue View showing an Architecture Violation 
These images are generated by default but in case of any problems, consult
the corresponding option documentation for
Architecture Violations
and for
Cyclic Dependencies
.
Rule Texts
For most issues we provide additional explanations, i.e. the rule that was violated by
the issue for further investigation. In the
example you can see a violation of a MISRA
rule and the rule text as an excerpt from the MisraC2012 ruleset. For some rulesets
(currently MISRA and AUTOSAR) the link in the footer can be
configured in the Rules section to point
to a custom location.
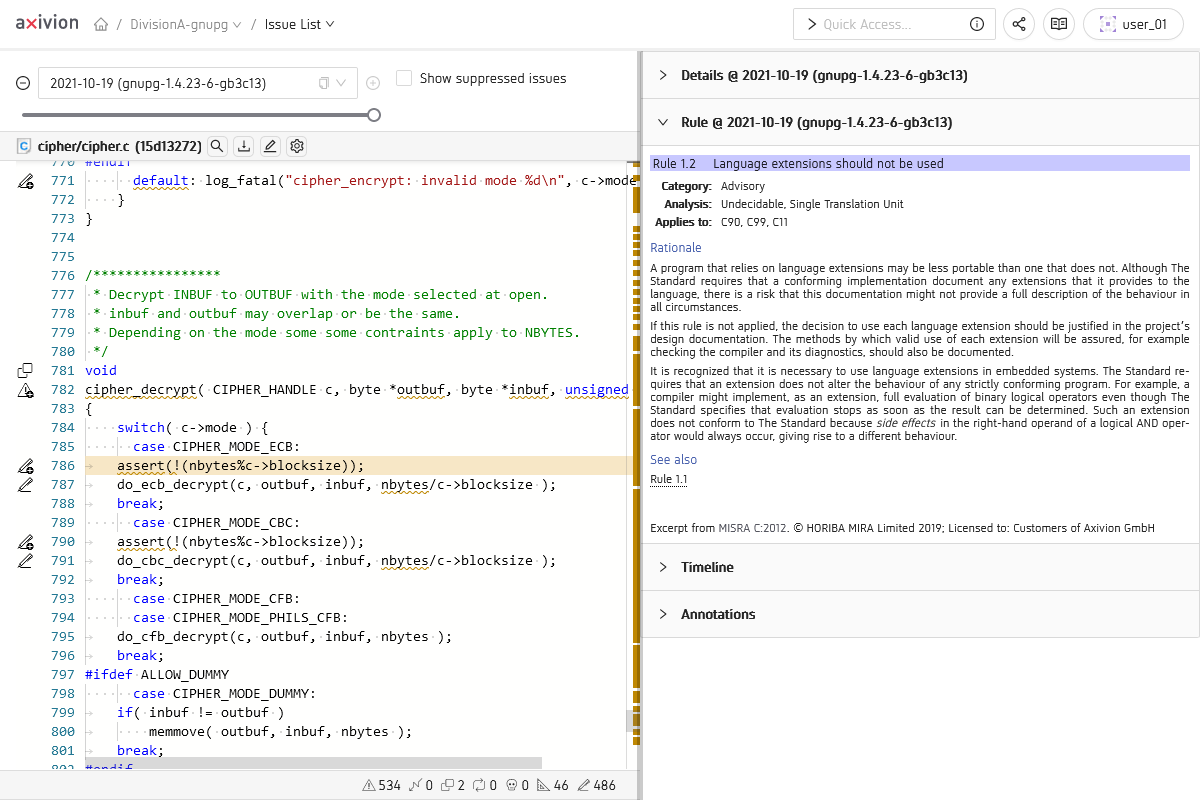
IssueView showing a Style Violation  of a MISRA Rule
Timeline
In the sidebar there is also the Timeline panel that is mostly interesting for
Metric Violations  . For those it displays the
development of the corresponding
. For those it displays the
development of the corresponding Metric value over time.
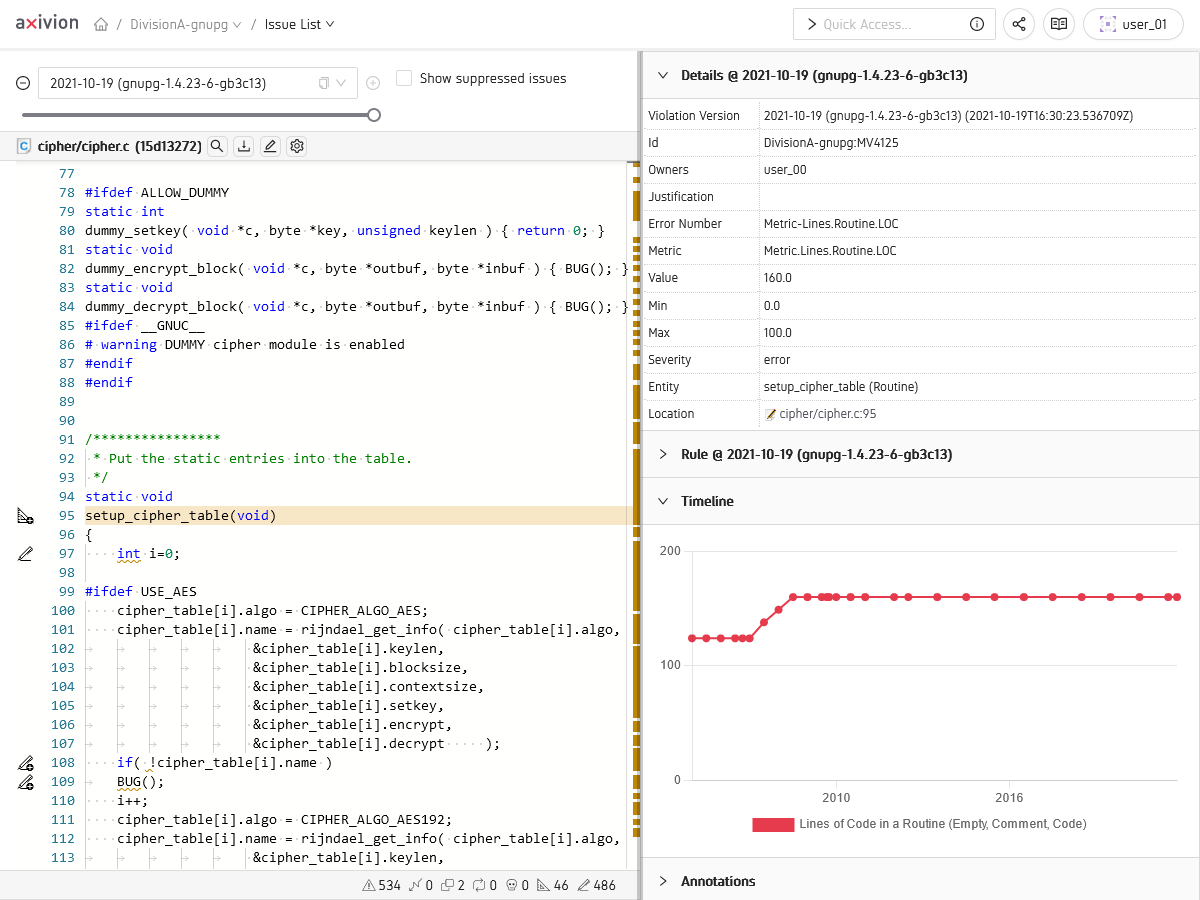
IssueView showing a Metric Violation and a plot
of the Metric over time
For other Issue Kinds the plot visualizes the version range when the issue was active.
Owners
Issue Owners are determined by the Analysis
configuration which usually consults the
Version Control System.
When a version is analyzed and an issue is found, the Version Control System is usually queried for e.g. the last user that changed the line of source code where the issue was found.
For Issues that involve multiple relevant lines of code,
e.g. a Clone
or a Cycle the Analysis will often assign
multiple owners.
There are other ways to assign Owners,
e.g. by mapping file patterns
to users or by marking files to be owned by NOBODY or by mapping issues
from one user to another.
Viewing Issue Ownerships sometimes can be a delicate matter which is why there exists
a separate permission necessary
to be able to view the Issue Owners or to be able to filter the
Issue Table by specific Owners.
Most importantly the ownership of an issue decides on whether an issue appears in
the list of a Dashboard User’s own issues and consequently on what issues’
appearance or disappearance a user is (by default) notified via the
Erosion Notifications.
Suppressions and Justifications
A Suppression is basically an issue property saying whether to display the issue by
default in the Dashboard or whether to import the issue at all into the Dashboard.
A Justification is an explicitly provided, short text describing why an issue found
by the analysis is being tolerated instead of fixed by changing the code.
The way in which they are provided is configured via the Analysis Configuration.
Suppressions and Justifications are not editable from the Dashboard as the idea
is to have them as close to the source location of the issue as possible though it is
also possible to define them e.g. for entire files.
Ideally, a Suppression is accompanied by a Justification right at the source
location, but this is optional and in fact, a Justification can also be provided
without a Suppression.
The import of Suppressed issues into the analysis results database must be
explicitly enabled
per project, which means, that by default Suppressed issues are dropped.
If the import of Suppressed issues is enabled, the predefined
Named Filter
called Hide Suppressed will be used by default in the
Issue Table
instead of Show All.
Also the corresponding table column will not be available in that case.
Note
Whether or not to combine a Justification with a Suppression is
totally up to your workflow. But keep in mind, that if you choose not to import
suppressed issues, that their Justifications
will only be imported if the justified issue is not suppressed
Annotations
Issue Annotations are special properties of an issues that can be added
post-analysis, i.e. from the Dashboard only. The analysis knows nothing about them.
For more information see the extra chapter on
Issue Annotations.