QMLギャラリーによるチャート
qmlを使ったさまざまな種類のチャートの使い方を説明します。
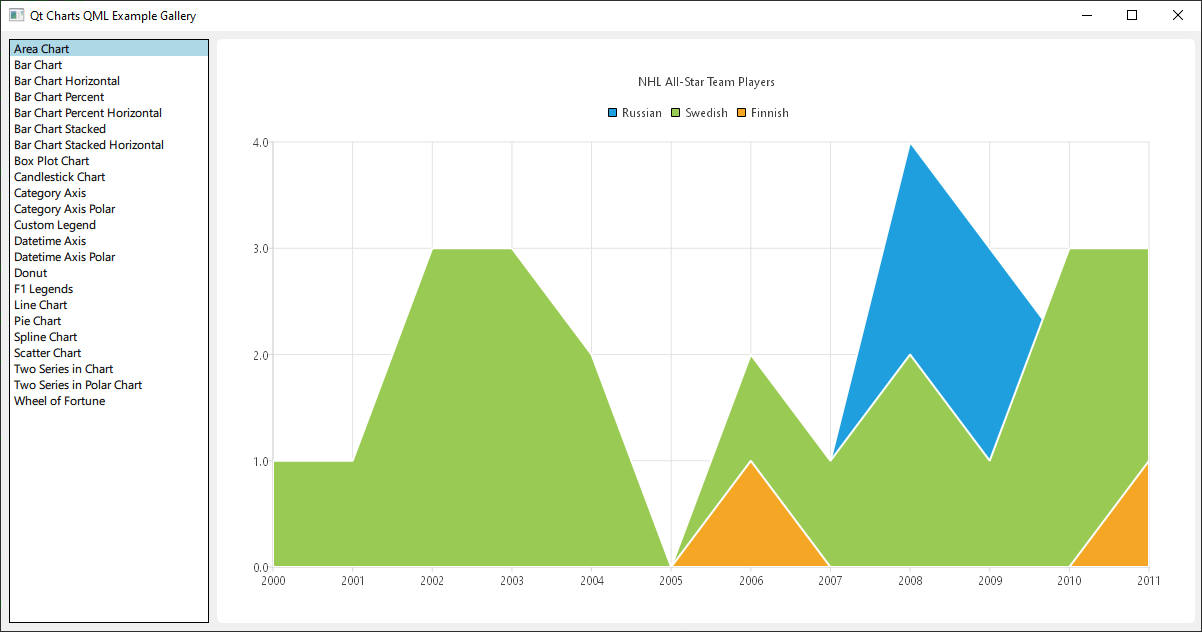
例を実行する
から例を実行するには Qt Creatorから例を実行するには、Welcome モードを開き、Examples から例を選択してください。詳しくはQt Creator: チュートリアルを参照してください:ビルドと実行。
これはQt Quick アプリケーションです。各チャート・タイプのファイルは example フォルダの qml ディレクトリにあり、この examples ディレクトリにある main.qml によってListView にアレンジされてロードされます。
このドキュメントでは、トップレベルのレイアウトやロードには焦点を当てず、Qt Charts QML APIの使い方に焦点を当てます。
依存関係を含む
すべての.qmlファイルは次のように始まります:
import QtQuick
import QtCharts
QML によるチャートの作成
各チャートの作成はChartView の作成から始まります。
円グラフを作成するには、PieSeries API といくつかの PieSlices を使います:
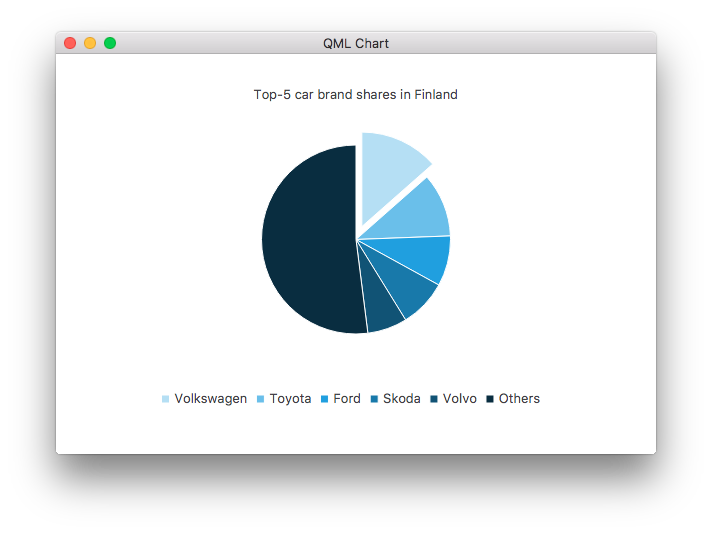
ChartView {
    id: chart
    title: "Top-5 car brand shares in Finland"
    anchors.fill: parent
    legend.alignment: Qt.AlignBottom
    antialiasing: true

    property variant othersSlice: 0

    PieSeries {
        id: pieSeries
        PieSlice { label: "Volkswagen"; value: 13.5 }
        PieSlice { label: "Toyota"; value: 10.9 }
        PieSlice { label: "Ford"; value: 8.6 }
        PieSlice { label: "Skoda"; value: 8.2 }
        PieSlice { label: "Volvo"; value: 6.8 }
    }

    Component.onCompleted: {
        // You can also manipulate slices dynamically, like append a slice or set a slice exploded
        othersSlice = pieSeries.append("Others", 52.0);
        pieSeries.find("Volkswagen").exploded = true;
    }
}
折れ線グラフも作成できます:
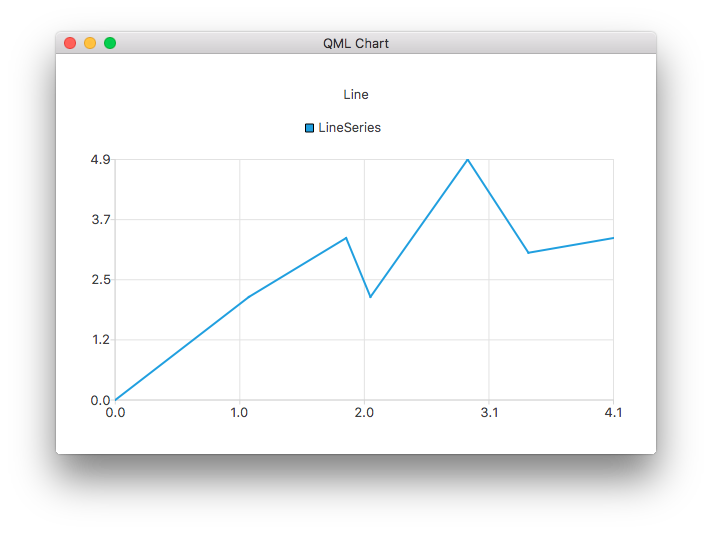
ChartView {
    title: "Line Chart"
    anchors.fill: parent
    antialiasing: true

    LineSeries {
        name: "Line"
        XYPoint { x: 0; y: 0 }
        XYPoint { x: 1.1; y: 2.1 }
        XYPoint { x: 1.9; y: 3.3 }
        XYPoint { x: 2.1; y: 2.1 }
        XYPoint { x: 2.9; y: 4.9 }
        XYPoint { x: 3.4; y: 3.0 }
        XYPoint { x: 4.1; y: 3.3 }
    }
}
そしてスプライン系列:
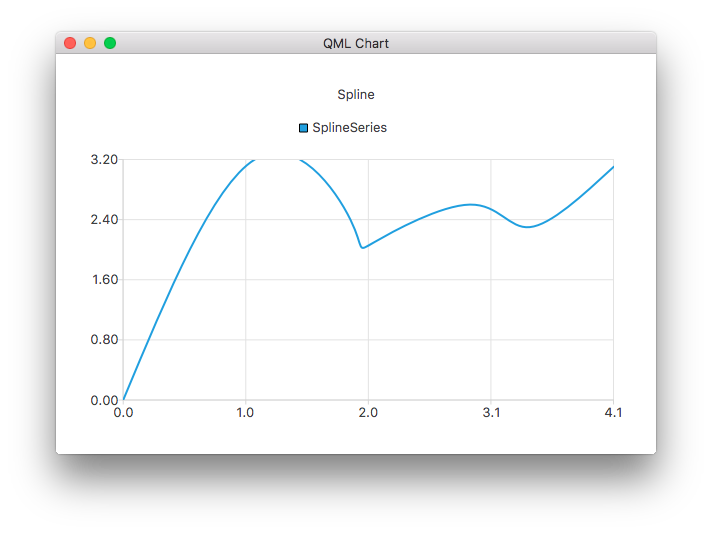
ChartView {
    title: "Spline Chart"
    anchors.fill: parent
    antialiasing: true

    SplineSeries {
        name: "Spline"
        XYPoint { x: 0; y: 0.0 }
        XYPoint { x: 1.1; y: 3.2 }
        XYPoint { x: 1.9; y: 2.4 }
        XYPoint { x: 2.1; y: 2.1 }
        XYPoint { x: 2.9; y: 2.6 }
        XYPoint { x: 3.4; y: 2.3 }
        XYPoint { x: 4.1; y: 3.1 }
    }
}
3つの面積系列を使用して、NHLオールスター選手の選択を示すグラフを作成することができます:

ChartView {
    title: "NHL All-Star Team Players"
    anchors.fill: parent
    antialiasing: true

    // Define x-axis to be used with the series instead of default one
    ValueAxis {
        id: valueAxis
        min: 2000
        max: 2011
        tickCount: 12
        labelFormat: "%.0f"
    }

    AreaSeries {
        name: "Russian"
        axisX: valueAxis
        upperSeries: LineSeries {
            XYPoint { x: 2000; y: 1 }
            XYPoint { x: 2001; y: 1 }
            XYPoint { x: 2002; y: 1 }
            XYPoint { x: 2003; y: 1 }
            XYPoint { x: 2004; y: 1 }
            XYPoint { x: 2005; y: 0 }
            XYPoint { x: 2006; y: 1 }
            XYPoint { x: 2007; y: 1 }
            XYPoint { x: 2008; y: 4 }
            XYPoint { x: 2009; y: 3 }
            XYPoint { x: 2010; y: 2 }
            XYPoint { x: 2011; y: 1 }
        }
    }
    ...
それから、散布図系列をいくつか:
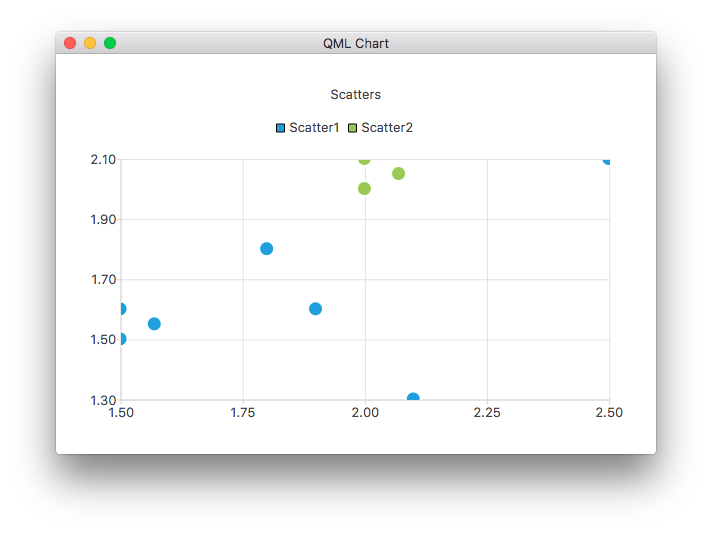
ChartView {
    title: "Scatter Chart"
    anchors.fill: parent
    antialiasing: true

    ScatterSeries {
        id: scatter1
        name: "Scatter A"
        XYPoint { x: 1.5; y: 1.5 }
        XYPoint { x: 1.5; y: 1.6 }
        XYPoint { x: 1.57; y: 1.55 }
        XYPoint { x: 1.8; y: 1.8 }
        XYPoint { x: 1.9; y: 1.6 }
        XYPoint { x: 2.1; y: 1.3 }
        XYPoint { x: 2.5; y: 2.1 }
    }

    ScatterSeries {
        name: "Scatter B"
        XYPoint { x: 2.0; y: 2.0 }
        XYPoint { x: 2.0; y: 2.1 }
        XYPoint { x: 2.07; y: 2.05 }
        XYPoint { x: 2.2; y: 2.9 }
        XYPoint { x: 2.4; y: 2.7 }
        XYPoint { x: 2.67; y: 2.65 }
    }
}
    ...
そして数種類の棒系列:
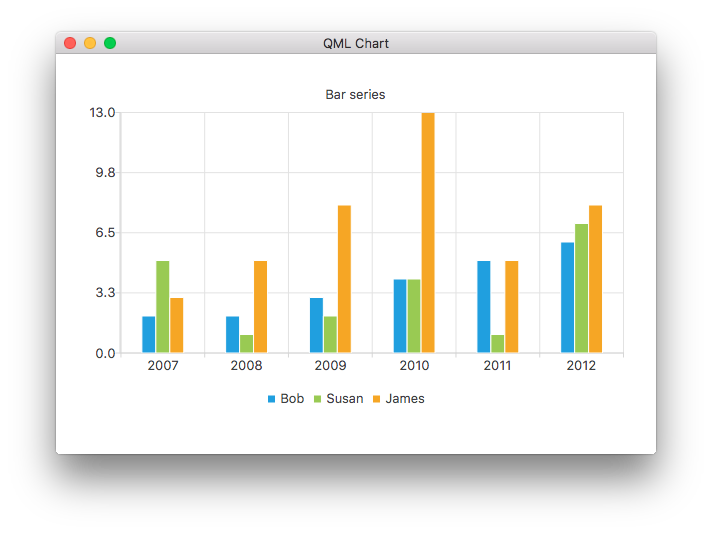
ChartView {
    title: "Bar Chart"
    anchors.fill: parent
    legend.alignment: Qt.AlignBottom
    antialiasing: true

    BarSeries {
        id: mySeries
        axisX: BarCategoryAxis { categories: ["2007", "2008", "2009", "2010", "2011", "2012" ] }
        BarSet { label: "Bob"; values: [2, 2, 3, 4, 5, 6] }
        BarSet { label: "Susan"; values: [5, 1, 2, 4, 1, 7] }
        BarSet { label: "James"; values: [3, 5, 8, 13, 5, 8] }
    }
}
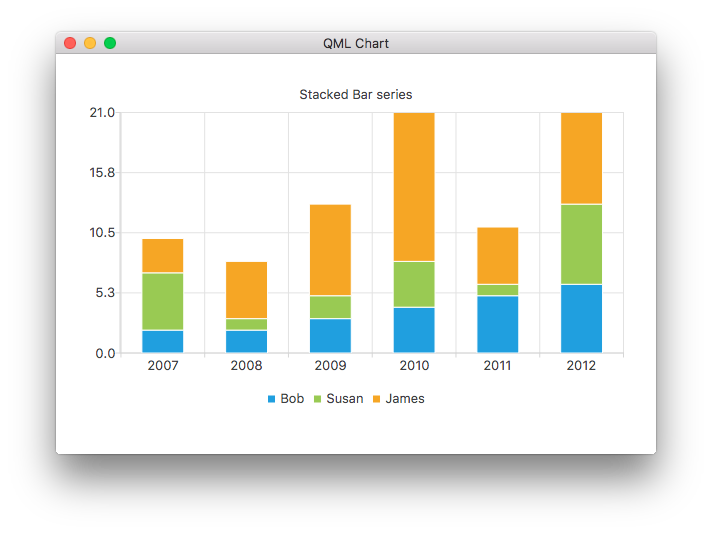
ChartView {
    title: "Stacked Bar Chart"
    anchors.fill: parent
    legend.alignment: Qt.AlignBottom
    antialiasing: true

    StackedBarSeries {
        axisX: BarCategoryAxis { categories: ["2007", "2008", "2009", "2010", "2011", "2012" ] }
        BarSet { label: "Bob"; values: [2, 2, 3, 4, 5, 6] }
        BarSet { label: "Susan"; values: [5, 1, 2, 4, 1, 7] }
        BarSet { label: "James"; values: [3, 5, 8, 13, 5, 8] }
    }
}
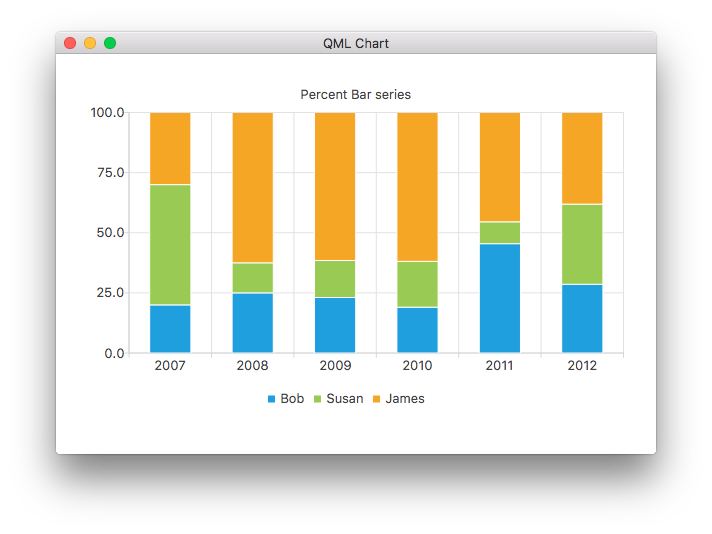
ChartView {
    title: "Percent Bar Chart"
    anchors.fill: parent
    legend.alignment: Qt.AlignBottom
    antialiasing: true

    PercentBarSeries {
        axisX: BarCategoryAxis { categories: ["2007", "2008", "2009", "2010", "2011", "2012" ] }
        BarSet { label: "Bob"; values: [2, 2, 3, 4, 5, 6] }
        BarSet { label: "Susan"; values: [5, 1, 2, 4, 1, 7] }
        BarSet { label: "James"; values: [3, 5, 8, 13, 5, 8] }
    }
}
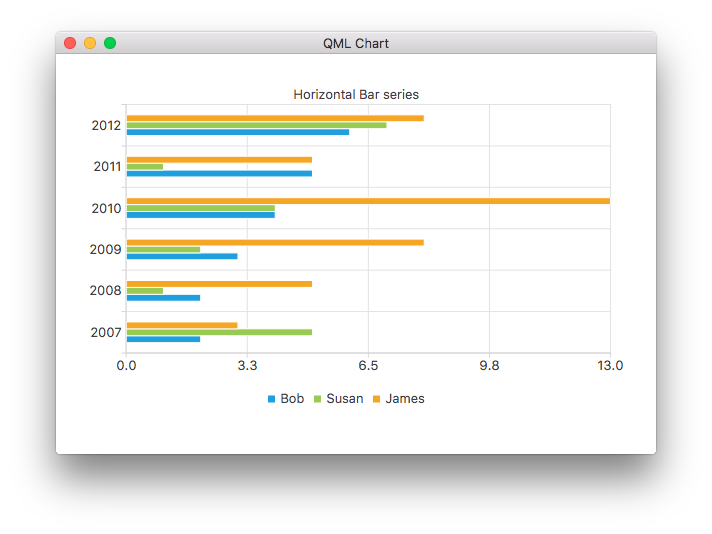
ChartView {
    title: "Horizontal Bar Chart"
    anchors.fill: parent
    legend.alignment: Qt.AlignBottom
    antialiasing: true

    HorizontalBarSeries {
        axisY: BarCategoryAxis { categories: ["2007", "2008", "2009", "2010", "2011", "2012" ] }
        BarSet { label: "Bob"; values: [2, 2, 3, 4, 5, 6] }
        BarSet { label: "Susan"; values: [5, 1, 2, 4, 1, 7] }
        BarSet { label: "James"; values: [3, 5, 8, 13, 5, 8] }
    }
}
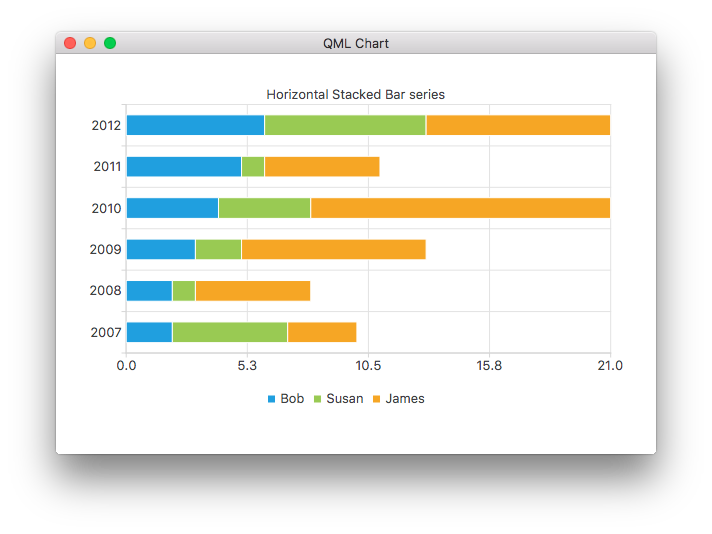
ChartView {
    title: "Horizontal Stacked Bar Chart"
    anchors.fill: parent
    legend.alignment: Qt.AlignBottom
    antialiasing: true

    HorizontalStackedBarSeries {
        axisY: BarCategoryAxis { categories: ["2007", "2008", "2009", "2010", "2011", "2012" ] }
        BarSet { label: "Bob"; values: [2, 2, 3, 4, 5, 6] }
        BarSet { label: "Susan"; values: [5, 1, 2, 4, 1, 7] }
        BarSet { label: "James"; values: [3, 5, 8, 13, 5, 8] }
    }
}
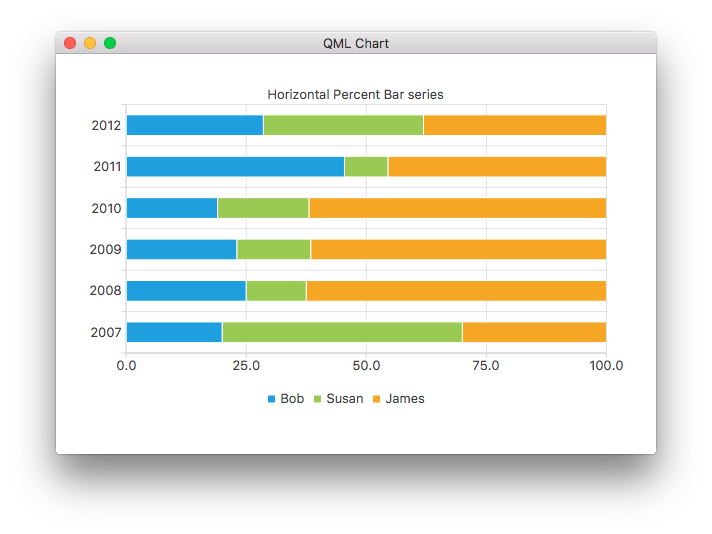
ChartView {
    title: "Horizontal Percent Bar Chart"
    anchors.fill: parent
    legend.alignment: Qt.AlignBottom
    antialiasing: true

    HorizontalPercentBarSeries {
        axisY: BarCategoryAxis { categories: ["2007", "2008", "2009", "2010", "2011", "2012" ] }
        BarSet { label: "Bob"; values: [2, 2, 3, 4, 5, 6] }
        BarSet { label: "Susan"; values: [5, 1, 2, 4, 1, 7] }
        BarSet { label: "James"; values: [3, 5, 8, 13, 5, 8] }
    }
}
2つの円系列を用いてドーナツ・チャートを作成する方法を示します:
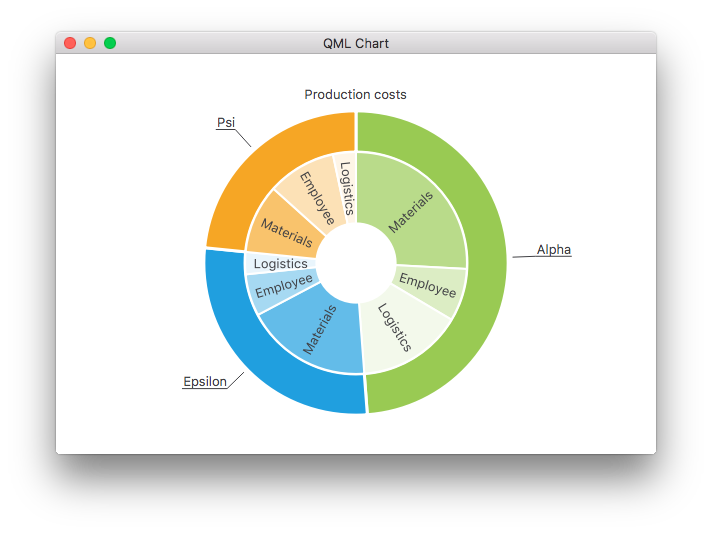
ChartView {
    id: chart
    title: "Production Costs"
    anchors.fill: parent
    legend.visible: false
    antialiasing: true

    PieSeries {
        id: pieOuter
        size: 0.96
        holeSize: 0.7
        PieSlice { id: slice; label: "Alpha"; value: 19511; color: "#99CA53" }
        PieSlice { label: "Epsilon"; value: 11105; color: "#209FDF" }
        PieSlice { label: "Psi"; value: 9352; color: "#F6A625" }
    }

    PieSeries {
        size: 0.7
        id: pieInner
        holeSize: 0.25

        PieSlice { label: "Materials"; value: 10334; color: "#B9DB8A" }
        PieSlice { label: "Employee"; value: 3066; color: "#DCEDC4" }
        PieSlice { label: "Logistics"; value: 6111; color: "#F3F9EB" }

        PieSlice { label: "Materials"; value: 7371; color: "#63BCE9" }
        PieSlice { label: "Employee"; value: 2443; color: "#A6D9F2" }
        PieSlice { label: "Logistics"; value: 1291; color: "#E9F5FC" }

        PieSlice { label: "Materials"; value: 4022; color: "#F9C36C" }
        PieSlice { label: "Employee"; value: 3998; color: "#FCE1B6" }
        PieSlice { label: "Logistics"; value: 1332; color: "#FEF5E7" }
    }

    Component.onCompleted: {
        // Set the common slice properties dynamically for convenience
        for (var i = 0; i < pieOuter.count; i++) {
            pieOuter.at(i).labelPosition = PieSlice.LabelOutside;
            pieOuter.at(i).labelVisible = true;
            pieOuter.at(i).borderWidth = 3;
        }
        for (var i = 0; i < pieInner.count; i++) {
            pieInner.at(i).labelPosition = PieSlice.LabelInsideNormal;
            pieInner.at(i).labelVisible = true;
            pieInner.at(i).borderWidth = 2;
        }
    }
}
さらに、Qt Quick 2では、qmlプロパティでアンチエイリアスが設定されます。
その他のチャート
このサンプルアプリの残りのチャートのウォークスルーについては、以下のリンクを参照してください。
ChartViewと系列のさまざまなビジュアル・プロパティをカスタマイズする方法を説明します。 | |
独自のカスタム凡例を作成する方法を示します。 | |
QMLアプリケーションで軸を使用する方法を説明します。 | |
F1凡例チャートを実装し、データソースとしてのリストモデルをデモンストレーションします。 | |
QMLアプリケーションでいくつかの異なる極座標チャートを作成する方法を示します。 |
© 2025 The Qt Company Ltd. Documentation contributions included herein are the copyrights of their respective owners. The documentation provided herein is licensed under the terms of the GNU Free Documentation License version 1.3 as published by the Free Software Foundation. Qt and respective logos are trademarks of The Qt Company Ltd. in Finland and/or other countries worldwide. All other trademarks are property of their respective owners.

