ScatterSeries QML Type
ScatterSeries 型は、散布図でデータを表示します。詳細...
| Import Statement: | import QtCharts 2.11 |
| In C++: | QScatterSeries |
| Inherits: |
プロパティ
- borderColor : color
- borderWidth : real
- brush : brush
- brushFilename : string
- count : int
- markerShape : enumeration
- markerSize : real
詳細説明
散布データはチャート上の点の集まりとして表示される。各ポイントには、横軸と縦軸の位置を決定する2つの値が指定されます。
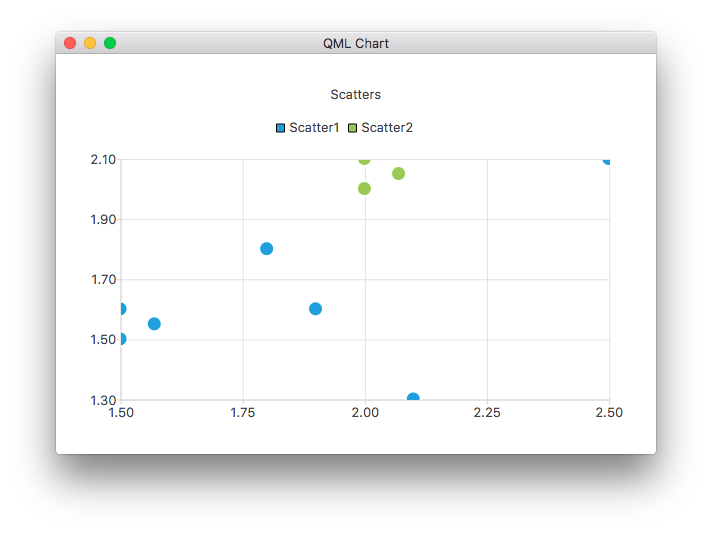
以下のQMLコードは、2つの単純な散布図系列を持つグラフの作成方法を示しています:
ChartView {
    title: "Scatter Chart"
    anchors.fill: parent
    antialiasing: true

    ScatterSeries {
        id: scatter1
        name: "Scatter A"
        XYPoint { x: 1.5; y: 1.5 }
        XYPoint { x: 1.5; y: 1.6 }
        XYPoint { x: 1.57; y: 1.55 }
        XYPoint { x: 1.8; y: 1.8 }
        XYPoint { x: 1.9; y: 1.6 }
        XYPoint { x: 2.1; y: 1.3 }
        XYPoint { x: 2.5; y: 2.1 }
    }

    ScatterSeries {
        name: "Scatter B"
        XYPoint { x: 2.0; y: 2.0 }
        XYPoint { x: 2.0; y: 2.1 }
        XYPoint { x: 2.07; y: 2.05 }
        XYPoint { x: 2.2; y: 2.9 }
        XYPoint { x: 2.4; y: 2.7 }
        XYPoint { x: 2.67; y: 2.65 }
    }
}
詳細については、QMLギャラリーを使ったチャートを参照してください。
プロパティのドキュメント
borderColor : color
マーカーの境界線を描画する色。
borderWidth : real
ボーダーラインの幅。デフォルトでは2.0です。
brush : brush
スキャッターシリーズのマーカーを描くのに使用するブラシ。
brushFilename : string
シリーズのブラシとして使用するファイル名。
count : int
シリーズのデータポイント数。
markerShape : enumeration
マーカーアイテムをレンダリングするときに使用される形状:
| 定数 | 説明 |
|---|---|
ScatterSeries.MarkerShapeCircle | マーカーは円です。これはデフォルト値です。 |
ScatterSeries.MarkerShapeRectangle | マーカーは矩形です。 |
markerSize : real
シリーズ内のポイントのレンダリングに使用されるマーカーのサイズ。
© 2026 The Qt Company Ltd. Documentation contributions included herein are the copyrights of their respective owners. The documentation provided herein is licensed under the terms of the GNU Free Documentation License version 1.3 as published by the Free Software Foundation. Qt and respective logos are trademarks of The Qt Company Ltd. in Finland and/or other countries worldwide. All other trademarks are property of their respective owners.
