
SplineSeries QML Type
データをスプライングラフとして表示します。詳細...
| Import Statement: | import QtCharts 2.12 |
| In C++: | QSplineSeries |
| Inherits: | |
| Status: | Deprecated |
このタイプは非推奨です。新しいコードでの使用は強くお勧めしません。
プロパティ
詳細な説明
スプライン系列は、QPainterPath がスプラインを描画するために必要なデータポイントとセグメント制御点を格納します。データが変更されると、制御点は自動的に計算されます。このアルゴリズムは、標準的なスプラインが描画できるよう、制御点を計算します。
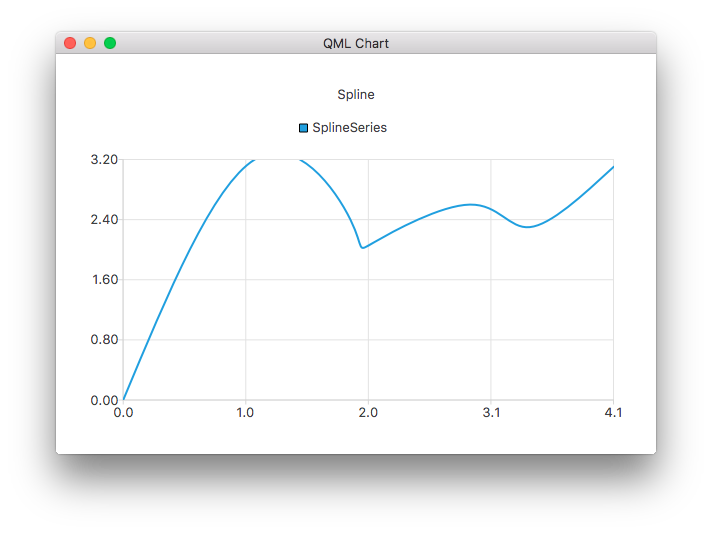
以下のQMLコードは、単純なスプラインチャートの作成方法を示しています:
ChartView {
    title: "Spline Chart"
    anchors.fill: parent
    antialiasing: true

    SplineSeries {
        name: "Spline"
        XYPoint { x: 0; y: 0.0 }
        XYPoint { x: 1.1; y: 3.2 }
        XYPoint { x: 1.9; y: 2.4 }
        XYPoint { x: 2.1; y: 2.1 }
        XYPoint { x: 2.9; y: 2.6 }
        XYPoint { x: 3.4; y: 2.3 }
        XYPoint { x: 4.1; y: 3.1 }
    }
}
プロパティのドキュメント
capStyle : Qt::PenCapStyle
線の端のスタイルを制御します。Qt.FlatCap 、Qt.SquareCap 、またはQt.RoundCap のいずれかに設定します。デフォルトでは、端のスタイルはQt.SquareCapです。
Qt::PenCapStyleも参照してください 。
count : int
系列に含まれるデータポイントの数。
style : Qt::PenStyle
Qt.NoPen Qt.DashDotLine 、 、 、 、 、または のいずれかに設定します。QML APIでは の使用はサポートされていません。デフォルトのスタイルはQt.SolidLineです。Qt.SolidLine Qt.DashLine Qt.DotLine Qt.DashDotDotLine Qt.CustomDashLine
Qt::PenStyleも参照してください 。
width : real
線の幅。デフォルトでは、幅は 2.0 です。
© 2026 The Qt Company Ltd. Documentation contributions included herein are the copyrights of their respective owners. The documentation provided herein is licensed under the terms of the GNU Free Documentation License version 1.3 as published by the Free Software Foundation. Qt and respective logos are trademarks of The Qt Company Ltd. in Finland and/or other countries worldwide. All other trademarks are property of their respective owners.
