HorizontalPercentBarSeries QML Type
分類された一連のデータを、各カテゴリのパーセンテージとして表示します。詳細...
| Import Statement: | import QtCharts 2.11 |
| In C++: | QHorizontalPercentBarSeries |
| Inherits: |
詳細説明
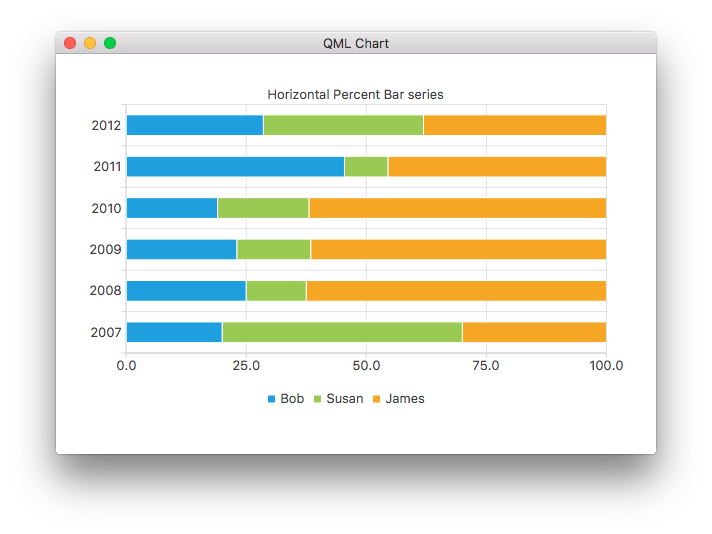
データは、1 つのカテゴリごとに 1 つのバーを持つ、水平方向に積み重ねられた均一なサイズの一連のバーとして描画されます。シリーズに追加された各バー・セットは、積み重ねられた各バーに 1 つのセグメントを寄与します。セグメントのサイズは、スタック内のすべてのセグメントの合計値と比較した、セグメントの値のパーセンテージに対応します。値がゼロのバーは描画されません。
次の QML コード・スニペットは、単純な水平パーセント棒グラフの作成方法を示しています:
ChartView {
    title: "Horizontal Percent Bar Chart"
    anchors.fill: parent
    legend.alignment: Qt.AlignBottom
    antialiasing: true

    HorizontalPercentBarSeries {
        axisY: BarCategoryAxis { categories: ["2007", "2008", "2009", "2010", "2011", "2012" ] }
        BarSet { label: "Bob"; values: [2, 2, 3, 4, 5, 6] }
        BarSet { label: "Susan"; values: [5, 1, 2, 4, 1, 7] }
        BarSet { label: "James"; values: [3, 5, 8, 13, 5, 8] }
    }
}
© 2026 The Qt Company Ltd. Documentation contributions included herein are the copyrights of their respective owners. The documentation provided herein is licensed under the terms of the GNU Free Documentation License version 1.3 as published by the Free Software Foundation. Qt and respective logos are trademarks of The Qt Company Ltd. in Finland and/or other countries worldwide. All other trademarks are property of their respective owners.
