HorizontalBarSeries QML Type
一連のデータをカテゴリ別にグループ化された横棒として表示します。もっと見る...
| Import Statement: | import QtCharts 2.11 |
| In C++: | QHorizontalBarSeries |
| Inherits: |
詳細説明
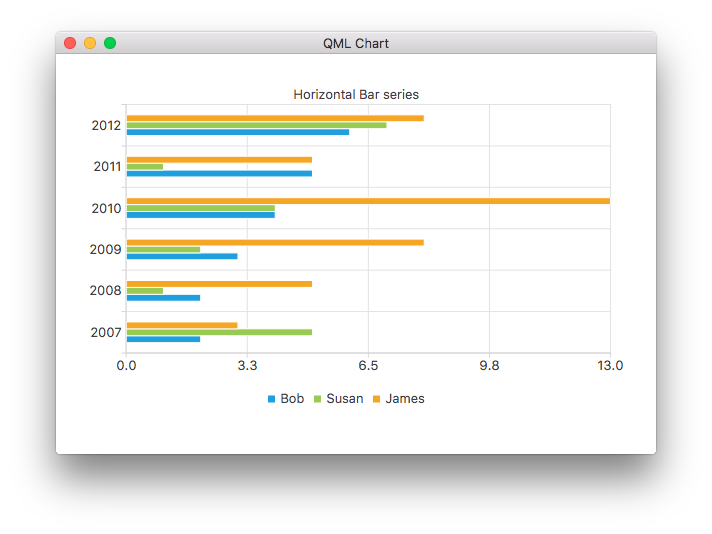
データは、カテゴリごとにグループ化された一連の水平棒グラフとして描画され、各棒グラフセットからカテゴリごとに1本の棒グラフが追加されます。
次の QML コード・スニペットは、単純な横棒グラフの作成方法を示しています:
ChartView {
    title: "Horizontal Bar Chart"
    anchors.fill: parent
    legend.alignment: Qt.AlignBottom
    antialiasing: true

    HorizontalBarSeries {
        axisY: BarCategoryAxis { categories: ["2007", "2008", "2009", "2010", "2011", "2012" ] }
        BarSet { label: "Bob"; values: [2, 2, 3, 4, 5, 6] }
        BarSet { label: "Susan"; values: [5, 1, 2, 4, 1, 7] }
        BarSet { label: "James"; values: [3, 5, 8, 13, 5, 8] }
    }
}
© 2026 The Qt Company Ltd. Documentation contributions included herein are the copyrights of their respective owners. The documentation provided herein is licensed under the terms of the GNU Free Documentation License version 1.3 as published by the Free Software Foundation. Qt and respective logos are trademarks of The Qt Company Ltd. in Finland and/or other countries worldwide. All other trademarks are property of their respective owners.
