HorizontalStackedBarSeries QML Type
一連のデータを、積み重ねられた横棒として表示します。詳細...
| Import Statement: | import QtCharts 2.11 |
| In C++: | QHorizontalStackedBarSeries |
| Inherits: |
詳細説明
シリーズに追加された各バーセットは、それぞれの積み上げバーに1つのセグメントを寄与します。
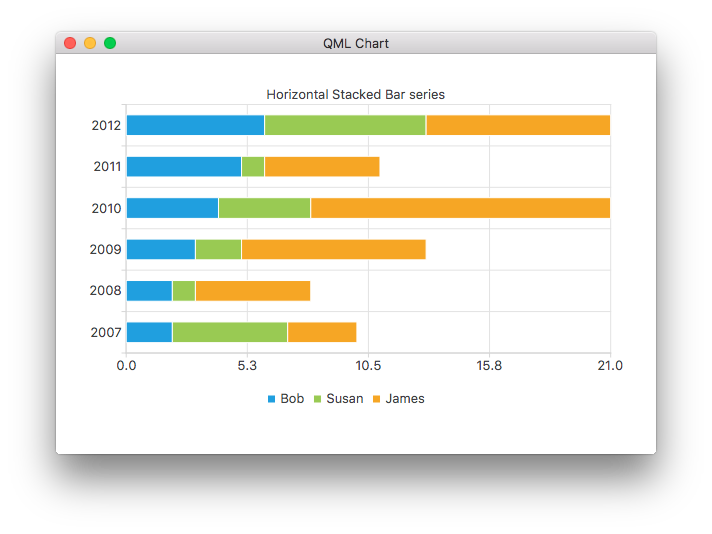
次の QML コード・スニペットは、単純な水平積み上げ棒グラフの作成方法を示しています:
ChartView {
    title: "Horizontal Stacked Bar Chart"
    anchors.fill: parent
    legend.alignment: Qt.AlignBottom
    antialiasing: true

    HorizontalStackedBarSeries {
        axisY: BarCategoryAxis { categories: ["2007", "2008", "2009", "2010", "2011", "2012" ] }
        BarSet { label: "Bob"; values: [2, 2, 3, 4, 5, 6] }
        BarSet { label: "Susan"; values: [5, 1, 2, 4, 1, 7] }
        BarSet { label: "James"; values: [3, 5, 8, 13, 5, 8] }
    }
}
© 2026 The Qt Company Ltd. Documentation contributions included herein are the copyrights of their respective owners. The documentation provided herein is licensed under the terms of the GNU Free Documentation License version 1.3 as published by the Free Software Foundation. Qt and respective logos are trademarks of The Qt Company Ltd. in Finland and/or other countries worldwide. All other trademarks are property of their respective owners.
