
QMLでリストモデルをデータソースとして使用する方法
注:これは 「Charts with QML Gallery」サンプルの一部です。
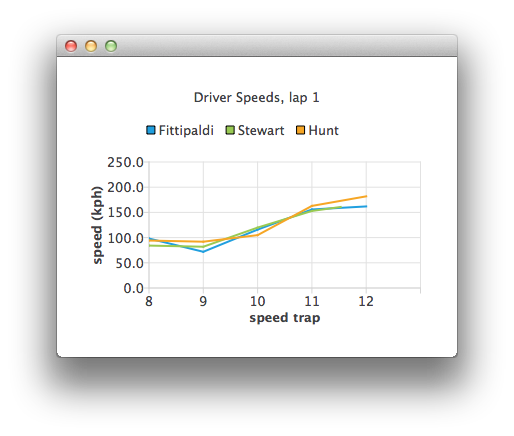
まず、空の ChartView を定義しましょう:
ChartView {
    id: chartView
    title: "Driver Speeds, lap 1"
    anchors.fill: parent
    legend.alignment: Qt.AlignTop
    animationOptions: ChartView.SeriesAnimations
    antialiasing: true
}
この ListModel では、ハードコーディングされたテストデータを使用しています。実際のアプリケーションでは、データソースとしてタイミングシステムが使用されることになります。
ListModel {
    // Hard-coded test data
    ListElement { speedTrap:0; driver: "Fittipaldi"; speed:104.12 }
    ListElement { speedTrap:0; driver:"Stewart"; speed:106.12 }
    ListElement { speedTrap:0; driver:"Hunt"; speed:106.12 }
    ...
// An example ListModel containing F1 legend drivers' speeds at speed traps
SpeedsList {
    id: speedsList
    Component.onCompleted: {
        timer.start();
    }
}
データはタイマーを使用して解析されます。各ドライバーを表す線グラフは、その都度動的に生成されます。
// A timer to mimic refreshing the data dynamically
Timer {
    id: timer
    interval: 700
    repeat: true
    triggeredOnStart: true
    running: false
    onTriggered: {
        root.currentIndex++;
        if (root.currentIndex < speedsList.count) {
            // Check if there is a series for the data already
            // (we are using driver name to identify series)
            var lineSeries = chartView.series(speedsList.get(root.currentIndex).driver);
            if (!lineSeries) {
                lineSeries = chartView.createSeries(ChartView.SeriesTypeLine,
                                                    speedsList.get(root.currentIndex).driver);
                chartView.axisY().min = 0;
                chartView.axisY().max = 250;
                chartView.axisY().tickCount = 6;
                chartView.axisY().titleText = "speed (kph)";
                chartView.axisX().titleText = "speed trap";
                chartView.axisX().labelFormat = "%.0f";
            }
            lineSeries.append(speedsList.get(root.currentIndex).speedTrap,
                              speedsList.get(root.currentIndex).speed);

            if (speedsList.get(root.currentIndex).speedTrap > 3) {
                chartView.axisX().max = Number(speedsList.get(root.currentIndex).speedTrap) + 1;
                chartView.axisX().min = chartView.axisX().max - 5;
            } else {
                chartView.axisX().max = 5;
                chartView.axisX().min = 0;
            }
            chartView.axisX().tickCount = chartView.axisX().max - chartView.axisX().min + 1;
        } else {
            // No more data, change x-axis range to show all the data
            timer.stop();
            chartView.animationOptions = ChartView.AllAnimations;
            chartView.axisX().min = 0;
            chartView.axisX().max = speedsList.get(root.currentIndex - 1).speedTrap;
        }
    }
}
© 2026 The Qt Company Ltd. Documentation contributions included herein are the copyrights of their respective owners. The documentation provided herein is licensed under the terms of the GNU Free Documentation License version 1.3 as published by the Free Software Foundation. Qt and respective logos are trademarks of The Qt Company Ltd. in Finland and/or other countries worldwide. All other trademarks are property of their respective owners.
