凡例をカスタマイズする
注: これはCharts with QML Galleryの例の一部です。
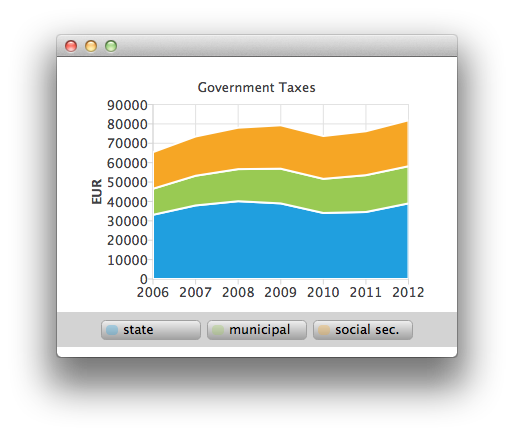
ここでは、ChartView API の組み込み凡例を使用する代わりに、独自のカスタム凡例を作成する方法を紹介します。
アプリケーションのメインビューには、積み重ねられたエリアチャートが表示されています。このようにして、積み重ねられた領域の1つが作成されます。ChartViewStacked.qmlとAnimatedAreaSeries.qmlを参照してください。

AnimatedAreaSeries {
    id: municipalSeries
    name: "municipal"
    axisX: axisX
    axisY: axisY
    borderWidth: 0
    upperSeries: LineSeries {
        id: municipalUpper
        XYPoint { x: 2006; y: 33119 + 13443 }
        XYPoint { x: 2007; y: 37941 + 15311 }
        XYPoint { x: 2008; y: 40122 + 16552 }
        XYPoint { x: 2009; y: 38991 + 17904 }
        XYPoint { x: 2010; y: 34055 + 17599 }
        XYPoint { x: 2011; y: 34555 + 19002 }
        XYPoint { x: 2012; y: 38991 + 19177 }
    }
    lowerSeries: stateUpper
}
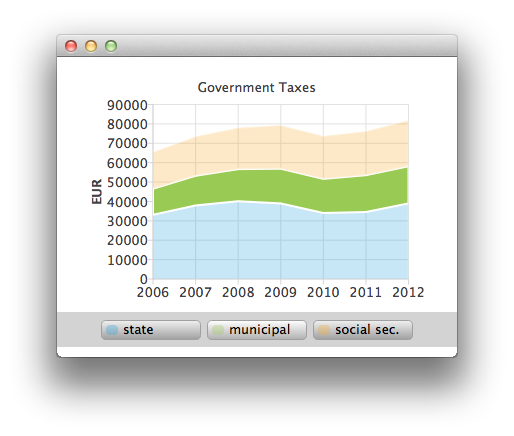
凡例の上にマウスを置くと、マウスを置いた系列がハイライトされます。(CustomLegend.qmlを参照)。

Row {
    id: legendRow
    anchors.centerIn: parent
    spacing: 10

    Repeater {
        id: legendRepeater
        model: legend.seriesCount
        delegate: legendDelegate
    }
}
Component {
    id: legendDelegate
    Rectangle {
        id: rect
    ...
        MouseArea {
            id: mouseArea
            anchors.fill: parent
            hoverEnabled: true
            onEntered: {
                rect.gradient = buttonGradientHovered;
                legend.entered(label.text);
            }
            onExited: {
                rect.gradient = buttonGradient;
                legend.exited(label.text);
                marker.opacity = 0.3;
                marker.height = 10;
            }
            onClicked: {
                legend.selected(label.text);
                marker.opacity = 1.0;
                marker.height = 12;
            }
        }
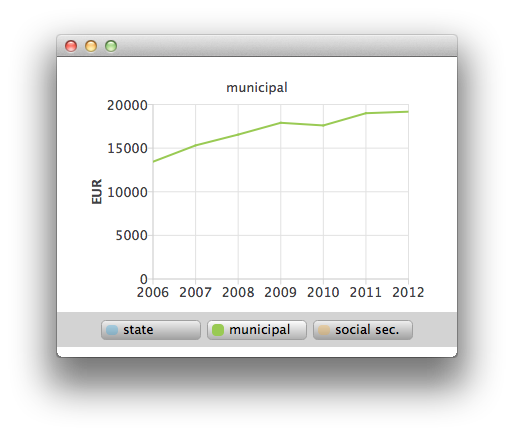
また、マウス・クリックによって、積み重ねられた領域の1つを選択して、線分系列として詳しく見ることもできます(ChartViewHighlighted.qmlを参照)。

ChartView {
    id: chartViewHighlighted

    property variant selectedSeries

    signal clicked

    legend.visible: false
    margins.top: 10
    margins.bottom: 0
    antialiasing: true

    LineSeries {
        id: lineSeries

        axisX: ValueAxis {
            min: 2006
            max: 2012
            labelFormat: "%.0f"
            tickCount: 7
        }
        axisY: ValueAxis {
            id: axisY
            titleText: "EUR"
            min: 0
            max: 40000
            labelFormat: "%.0f"
            tickCount: 5
        }
    }
© 2025 The Qt Company Ltd. Documentation contributions included herein are the copyrights of their respective owners. The documentation provided herein is licensed under the terms of the GNU Free Documentation License version 1.3 as published by the Free Software Foundation. Qt and respective logos are trademarks of The Qt Company Ltd. in Finland and/or other countries worldwide. All other trademarks are property of their respective owners.

