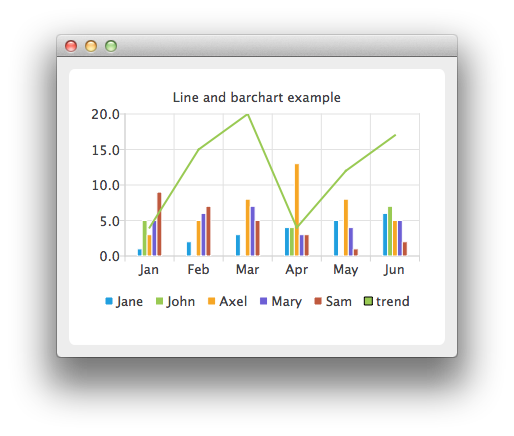
折れ線グラフと棒グラフの組み合わせ
注: これは、ウィジェット・ギャラリーによるチャートの例の一部です。
この例では、折れ線グラフと棒グラフを組み合わせ、両方の共通軸としてカテゴリ軸を使用しています。

ここで、棒系列のデータを作成します。
auto set0 = new QBarSet("Jane");
auto set1 = new QBarSet("John");
auto set2 = new QBarSet("Axel");
auto set3 = new QBarSet("Mary");
auto set4 = new QBarSet("Sam");

*set0 << 1 << 2 << 3 << 4 << 5 << 6;
*set1 << 5 << 0 << 0 << 4 << 0 << 7;
*set2 << 3 << 5 << 8 << 13 << 8 << 5;
*set3 << 5 << 6 << 7 << 3 << 4 << 5;
*set4 << 9 << 7 << 5 << 3 << 1 << 2;
棒系列を作成し、それにセットを追加します。各セットの最初の値は最初のカテゴリーに、2番目の値は2番目のカテゴリーに、といった具合にグループ化します。
auto barseries = new QBarSeries;
barseries->append(set0);
barseries->append(set1);
barseries->append(set2);
barseries->append(set3);
barseries->append(set4);
次に折れ線系列を作成し、そこにデータを追加する。データをバーチャートと一致させるために、インデックスを線系列のx値として使用し、最初のポイントが(0,値)、2番目のポイントが(1,値)、というようにする。
auto lineseries = new QLineSeries;
lineseries->setName("trend");
lineseries->append(QPoint(0, 4));
lineseries->append(QPoint(1, 15));
lineseries->append(QPoint(2, 20));
lineseries->append(QPoint(3, 4));
lineseries->append(QPoint(4, 12));
lineseries->append(QPoint(5, 17));
ここでチャートを作成し、両系列を追加する。
auto chart = new QChart;
chart->addSeries(barseries);
chart->addSeries(lineseries);
chart->setTitle("Line and Bar Chart");
チャートに系列を正しく表示させるためには、系列のカスタム軸を作成する必要があります。カスタム軸を作成しないと、各系列は(単一系列の場合のように)チャートの最大面積を使用するようにスケーリングされ、結果は正しくありません。カスタム軸では、両方の系列の範囲を同じ軸に従うように設定します。X軸にはQBarCategoryAxis 、Y軸にはQValuesAxisを使用します。
QStringList categories;
categories << "Jan" << "Feb" << "Mar" << "Apr" << "May" << "Jun";
auto axisX = new QBarCategoryAxis;
axisX->append(categories);
chart->addAxis(axisX, Qt::AlignBottom);
lineseries->attachAxis(axisX);
barseries->attachAxis(axisX);
axisX->setRange(QString("Jan"), QString("Jun"));

auto axisY = new QValueAxis;
chart->addAxis(axisY, Qt::AlignLeft);
lineseries->attachAxis(axisY);
barseries->attachAxis(axisY);
axisY->setRange(0, 20);
そして、凡例も表示します。
chart->legend()->setVisible(true);
chart->legend()->setAlignment(Qt::AlignBottom);
最後に、チャートをビューに追加します。
createDefaultChartView(chart);
© 2025 The Qt Company Ltd. Documentation contributions included herein are the copyrights of their respective owners. The documentation provided herein is licensed under the terms of the GNU Free Documentation License version 1.3 as published by the Free Software Foundation. Qt and respective logos are trademarks of The Qt Company Ltd. in Finland and/or other countries worldwide. All other trademarks are property of their respective owners.

