ドリルダウンの実装
注: これはウィジェット・ギャラリーのチャート例の一部です。
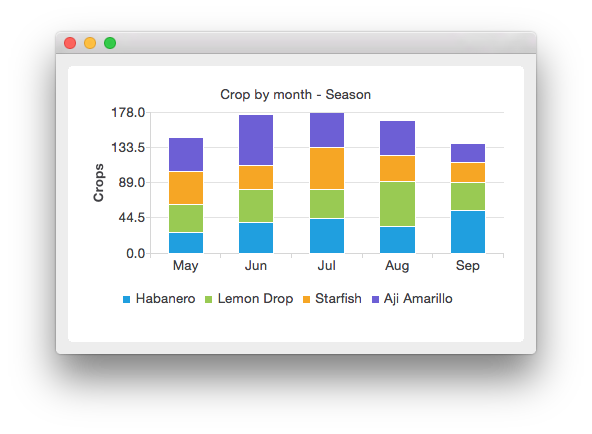
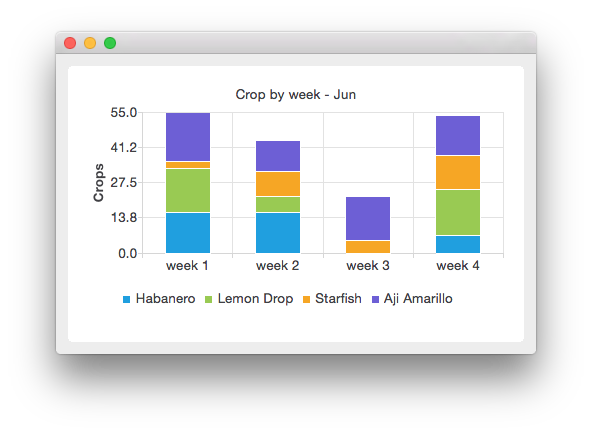
ここでは、シーズン中の様々な唐辛子の収穫を示す積み上げ棒グラフを作成します。シーズン表示では、収穫は月ごとにグループ化されています。週表示にドリルダウンするには、選択した月を右クリックします。週間ビューでは、クリックした月の収穫が週ごとに表示されます。
シーズン表示はこのようになっている:

月をクリックすると、その月の収穫が表示される:

まず、ドリルダウン系列クラスを定義します。このクラスは、積み上げ棒系列にカテゴリを追加し、他のドリルダウン系列にカテゴリをマッピングします。ドリルダウン・シリーズの目的は、ドリルダウン構造の知識を格納することです。mapDrilldownSeries 関数は、カテゴリを指定された系列にマッピングします。drilldownSeries(intカテゴリー)関数でカテゴリーのマッピングを要求できます。
class StackedDrilldownSeries : public QStackedBarSeries
{
    Q_OBJECT
public:
    StackedDrilldownSeries(const QStringList &categories, int maxValue, QObject *parent = nullptr);

    void mapDrilldownSeries(int index, StackedDrilldownSeries *drilldownSeries);
    StackedDrilldownSeries *drilldownSeries(int index) const;
    QStringList categories() const;
    int maxValue() const;

private:
    QMap<int, StackedDrilldownSeries *> m_drilldownSeries;
    QStringList m_categories;
    int m_maxValue = 0;
};
次に、マウスクリックのハンドラを実装した独自のドリルダウンチャートを定義します。すべてのQBarSeries 派生クラスは、系列がマウスでクリックされると clicked(QBarSet*, int) シグナルを送出します。パラメータQBarSet にはクリックされたバー・セットへのポインタが格納され、パラメータ int にはクリックされたカテゴリのインデックスが格納されます。
class StackedDrilldownChart : public QChart
{
    Q_OBJECT
public:
    explicit StackedDrilldownChart(QGraphicsItem *parent = nullptr, Qt::WindowFlags wFlags = {});

    void changeSeries(StackedDrilldownSeries *series);

public slots:
    void handleClicked(int index, QBarSet *);

private:
    StackedDrilldownSeries *m_currentSeries = nullptr;
    QBarCategoryAxis *m_axisX = nullptr;
    QValueAxis *m_axisY = nullptr;
};
これでドリルダウン・クラスができたので、それらを使い始めることができます。最初にチャートを作成します。
auto drilldownChart = new StackedDrilldownChart;
drilldownChart->setAnimationOptions(QChart::SeriesAnimations);
ドリルダウン系列を構築するカテゴリを定義します。
// Define categories
const QStringList months = {
    "May", "Jun", "Jul", "Aug", "Sep"
};
const QStringList weeks = {
    "week 1", "week 2", "week 3", "week 4"
};
const QStringList plants = {
    "Habanero", "Lemon Drop", "Starfish", "Aji Amarillo"
};
ドリルダウン構造を作成するために、まずseasonSeriesと呼ぶトップレベルの系列を作成します。seasonSeriesの各月について、その月のより詳細なデータを含むweeklySeriesと呼ばれるドリルダウン系列を作成します。weeklySeriesでは、ドリルダウンハンドラを使用してseasonSeriesに戻します。そのために、シリーズにマッピングを追加します。seasonSeriesは各月のweeklySeriesにマッピングされます。各 weeklySeries は seasonSeries にマッピングされます。マッピングを機能させるために、シリーズからクリックされたシグナルをドリルダウンチャートに接続します。
// Create drilldown structure
auto seasonSeries = new StackedDrilldownSeries(months, 320, drilldownChart);
seasonSeries->setName("Crop by month - Season (Click on bar to drill down)");

// Each month in season series has drilldown series for weekly data
for (int month = 0; month < months.count(); month++) {
    // Create drilldown series for every week
    auto weeklySeries = new StackedDrilldownSeries(weeks, 80, drilldownChart);
    seasonSeries->mapDrilldownSeries(month, weeklySeries);

    // Drilling down from weekly data brings us back to season data.
    for (int week = 0; week < weeks.count(); week++) {
        weeklySeries->mapDrilldownSeries(week, seasonSeries);
        weeklySeries->setName(QString("Crop by week - " + months.at(month)));
    }

    // Use clicked signal to implement drilldown
    QObject::connect(weeklySeries, &StackedDrilldownSeries::clicked,
                     drilldownChart, &StackedDrilldownChart::handleClicked);
}

// Enable drilldown from season series using clicked signal
QObject::connect(seasonSeries, &StackedDrilldownSeries::clicked,
                 drilldownChart, &StackedDrilldownChart::handleClicked);
ドリルダウン構造の準備ができたら、データを追加します。ここでは、各週の各プラントについてランダムな作物を生成します。毎月の作物は、毎週の作物から計算され、毎月の系列に値として設定されます。
// Fill monthly and weekly series with data
for (const QString &plant : plants) {
    auto monthlyCrop = new QBarSet(plant);
    for (int month = 0; month < months.count(); month++) {
        auto weeklyCrop = new QBarSet(plant);
        for (int week = 0; week < weeks.count(); week++)
            *weeklyCrop << QRandomGenerator::global()->bounded(20);
        // Get the drilldown series from season series and add crop to it.
        seasonSeries->drilldownSeries(month)->append(weeklyCrop);
        *monthlyCrop << weeklyCrop->sum();
    }
    seasonSeries->append(monthlyCrop);
}
ここでは、最初にトップ・レベルの系列を表示するようにチャートを設定します。
// Show season series in initial view
drilldownChart->changeSeries(seasonSeries);
drilldownChart->setTitle(seasonSeries->name());
© 2025 The Qt Company Ltd. Documentation contributions included herein are the copyrights of their respective owners. The documentation provided herein is licensed under the terms of the GNU Free Documentation License version 1.3 as published by the Free Software Foundation. Qt and respective logos are trademarks of The Qt Company Ltd. in Finland and/or other countries worldwide. All other trademarks are property of their respective owners.

