Explore
Select a project in the dashboard to open Test Center's project details page, and then select Explore.
The Explore view contains a detailed overview of your projects' tests, organized by Batch and filtered by the Label you set during result upload. You can view the uploaded results in a number of ways.
Breadcrumbs bar
The breadcrumbs bar indicates the granularity of the view and identifies the tests you are currently looking at. The first element of the breadcrumbs bar displays the name of the currently selected Batch and enables you to switch back and forth between different batches.

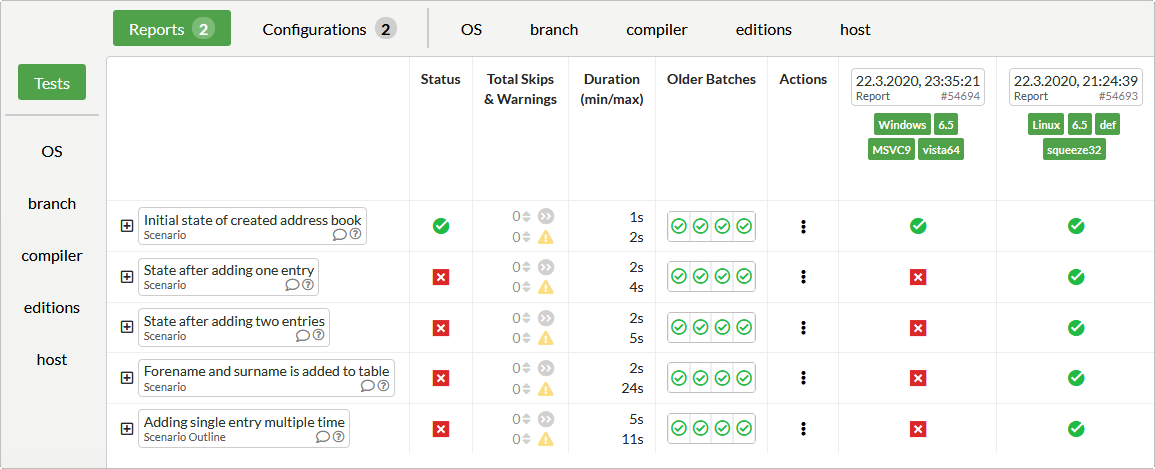
Explore View Breadcrumbs Bar
The last element indicates the granularity of the view. That is, the level of the test-structure you are currently looking at. Furthermore, it enables you to select the granularity. For example: Test Suite > Test Case > Feature > Scenario > Step > Section.
The available options depend on whether the test is a BDD test case and on the test sections that were defined.
Reports and tests table
In the left vertical pane, select labels to filter the data that is shown in the table. By default, an overview of your test suite and its history is provided:
- The first column shows the name of the test element.
- Status indicates whether a test passed (
 PASS icon ) ,failed (
 FAIL icon ), was annotated as an unexpected pass (
 XPASS icon ), or was annotated as an expected fail (
 XFAIL icon ) across all uploaded reports of a batch.
Click an indicator in the column to open the Verifications view.
- Total Skips & Warnings shows an aggregation of all skips and warnings, and indicates whether the number of skips and warnings changed since the last execution.
- Duration displays the minimum and maximum time needed for the execution of a test across the reports of a batch.
- Older Batches provides a graphical overview of the last four batches. That is, it shows whether a test passed or failed recently.
- Actions provides access to additional functionality. If you have activated the Jira or Zephyr integration, you can create issues or test items in the 3rd-party system.
- Following columns will show the results of each uploaded report for this batch. In the header the execution date, as well its labels, of the report are shown. If a
.reference.urllabel was set it will also be rendered with the title and a link as specified in How to Upload results.
Explore Reports and Tests
To use the table in a one-dimensional manner, select Reports on the horizontal axis and a single label on the vertical axis, such as OS. This filters content by the label (here, operating systems), and displays status and duration. To use the table in a two-dimensional manner, select a different label on the horizontal and vertical the axis. This groups the labels according to your configuration.
Batch view
By default, Entire Batch is selected to include in the table all tests across all reports that have been uploaded to the currently selected batch and that match the selected hierarchy in the breadcrumbs bar.
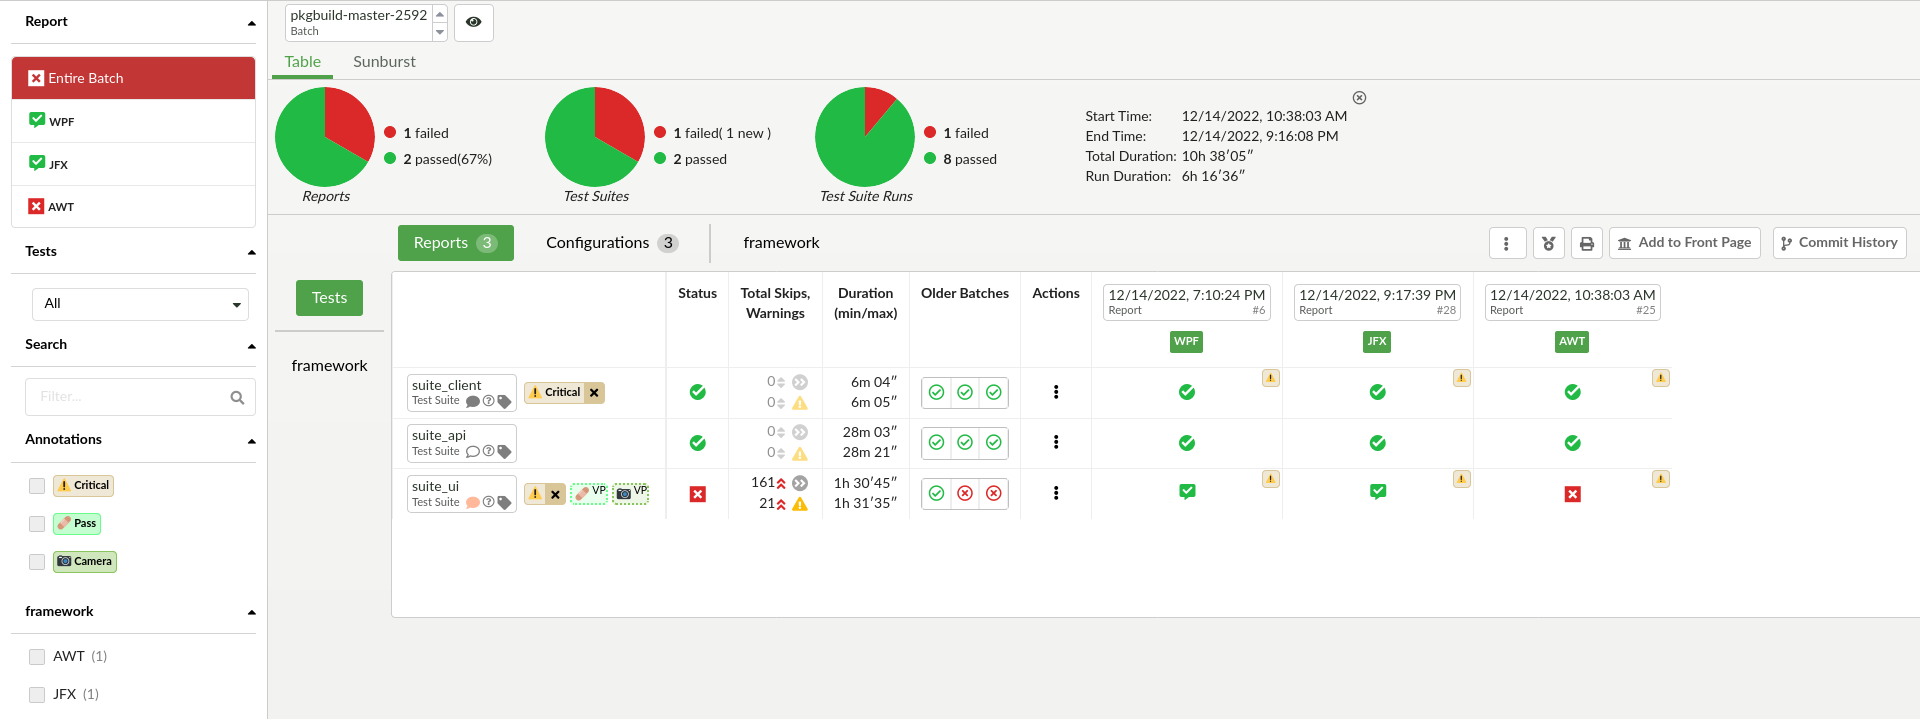
Batch View
At the top of the batch view, you can find the batch summary. In addition to the Start Time, End Time, Total Duration, and Run Duration, the batch summary includes three pie charts that summarize:
- The number of passed and failed reports
- The number of passed and failed test cases (summarized across all iterations and configurations)
- The number of passed and failed test case runs (individually counting each iteration or configuration)
The following actions can be done with above the test results table several buttons
- Additional Actions: Hovering the cursor over the icon
 the following actions are available.
- Delete Batch: Permanently delete an entire batch. including all results and attachments. Only available to Administrators.
- Freeze/Unfreeze Batch: Freeze current batch's results.
- Rename Batch: Rename the current batch.
- Add labels to all reports: Add one or more labels to all the reports.
- Download all batch reports: Download an archive with all the test reports.
- Create Badge: Create embeddable result badge.
- Printable Report: Opens the Printable Report view.
- Add to Front Page: Add one of the following summaries, of the currently configured result view, to the dashboard.
- Test items table Shows a result summary for the test items shown in the Explore view.
- Pie Charts summary Adds the entire summary section of the Explore view to the dashboard. It contains three pie charts that show the number of passed Reports, Test Suites, and Test Suite Runs.
- Results summary Shows the overall test result as well as a textual summary of the number of passed and failed Reports and Tests.
- Commit History: If a project is connected to an active repository
Single report view
Select a report in the Report list to open the single report view and add the report to the breadcrumbs bar. The summarized test status and the labels of the report are displayed.
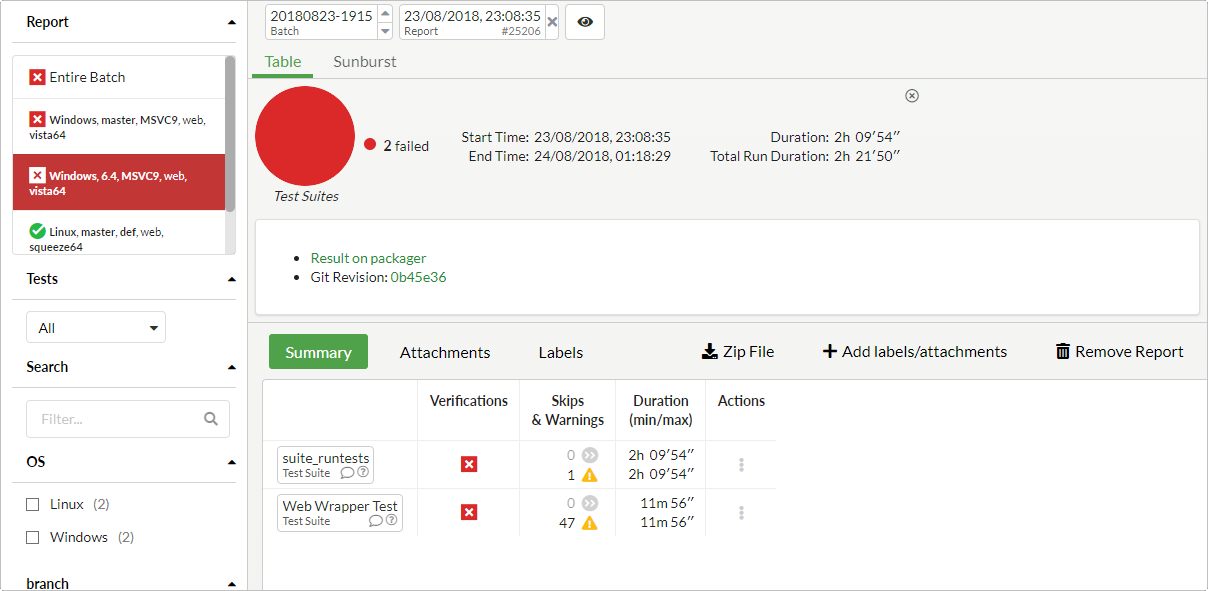
Single Report View (as Administrator)
The single report view contains the following elements:
- A report summary, similar to the one used when viewing the entire batch.
- If the report contains a
README.mdfile in the markdown format, its contents are displayed below the report summary. This is a good way of connecting your results to custom metadata. Examples include hyperlinks to build artifacts and the version control system revision of your AUT used for this test execution. - Summary shows your test results, where you can also open the Verifications view.
- Attachments lists all files attached to this report and allows you to view their content. Additionally, administrators can remove attachments.
- Labels lists all labels that have been added to this report. Additionally, administrators can remove labels.
- Zip File downloads a zipped folder containing the test results and attachments of this report.
- Administrators can click Add labels/attachments to upload attachments and add labels to the report.
- Administrators can click Remove Report to permanently delete the report, including all of its results and attachments. Deleting the last report of a batch will delete the batch as well.
Note: UI elements for actions that require administrator access (such as editing or removing the report) are only visible when you are logged in as an administrator.
Sunburst view
Select Sunburst for an alternative representation of the project test data.
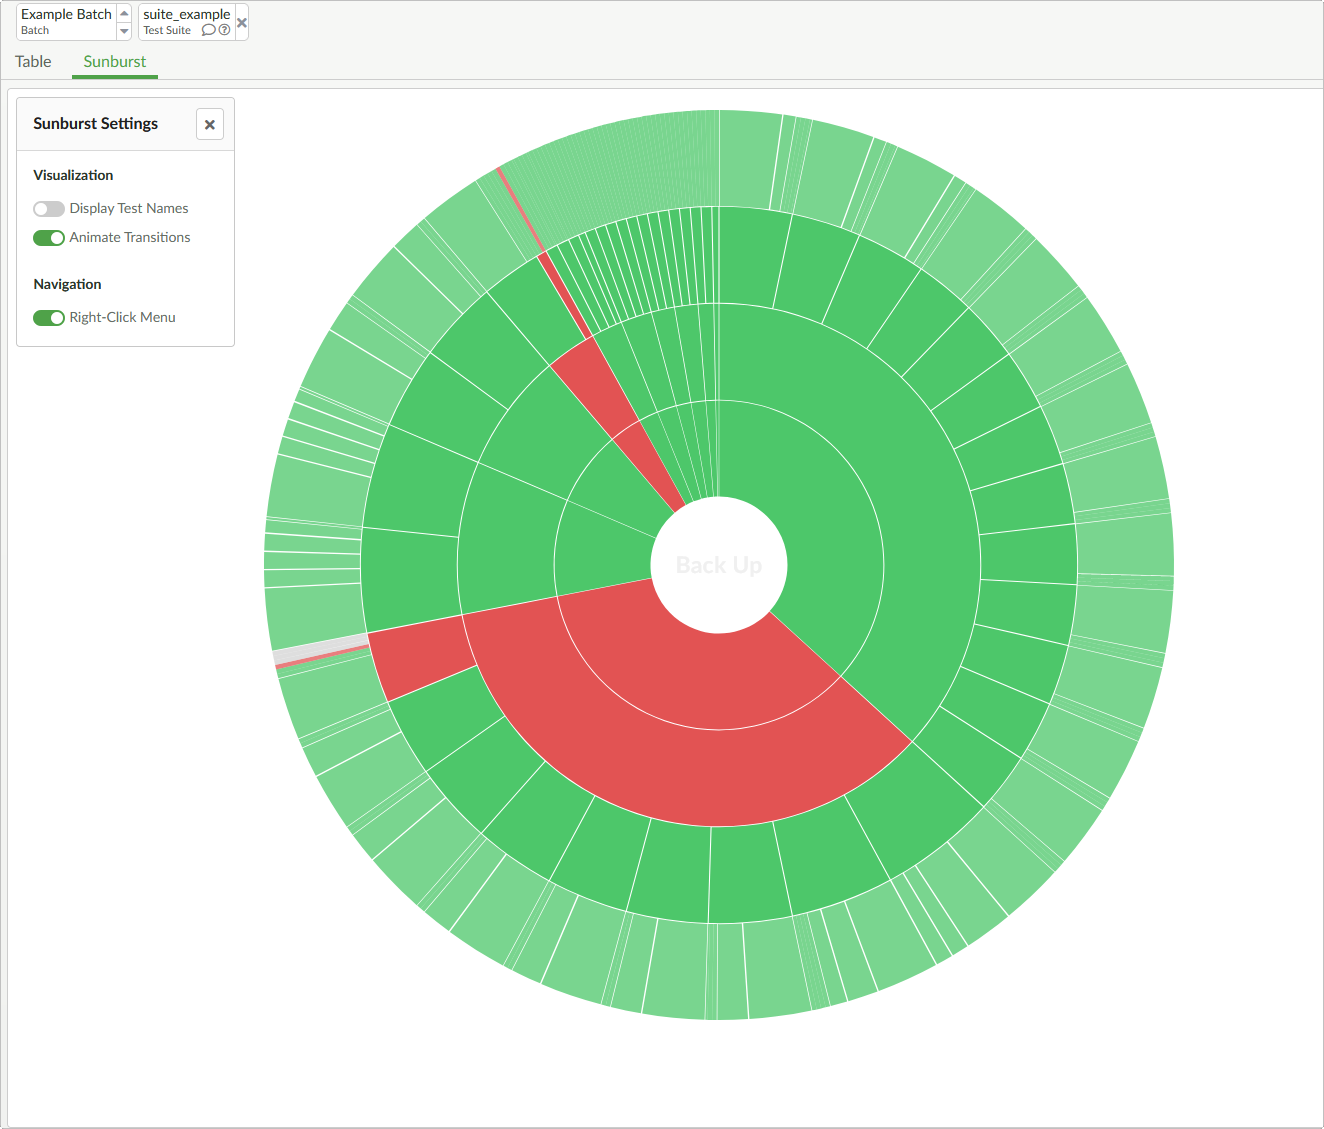
Sunburst View
Each slice of the sunburst diagram represents a test item. The slices are colored green if the test item passed, red if it failed, and gray if it was skipped. The size of a slice is determined by the number of verifications associated with the item.
Hover the mouse over sunburst diagram slices to display a tooltip that contains the name and type of the test item. Click a slice to set the origin of the sunburst diagram to the clicked test item (drill down). Click the center of the sunburst diagram to set the origin to the parent of the currently selected test item (drill up).
Click the  button in the top left corner next to the diagram to specify Sunburst Settings:
- Display Test Names shows and hides test item names on the diagram slices. Since the space within the sunburst slices is very limited, the text has to be truncated by default. Since the test names are also visible in the tooltips, you can hide the names to achieve a cleaner look.
- Animate Transitions enables transition animations when drilling down or up. When you have a lot of test items, the animations might become very computationally expensive, so you can turn off this option to reduce the strain put on your browser.
- Right-clicking on a diagram slice opens a right-click menu that allows you to easily jump to the Verifications, History, or Table view. If you prefer the default browser right-click menu, turn off Right-Click Menu. The same menu will then open when left-clicking.
Code Coverage view
The table in the Explore view displays coverage values (in %) from Coco coverage reports next to the test status. Click the coverage value to select the related report and switch to the Code Coverage view. You can also open the view by selecting Code Coverage.
In Coverage in the filter pane on the left, select the coverage method: function, line, statement (block), decision, condition, MC/DC, or MCC.
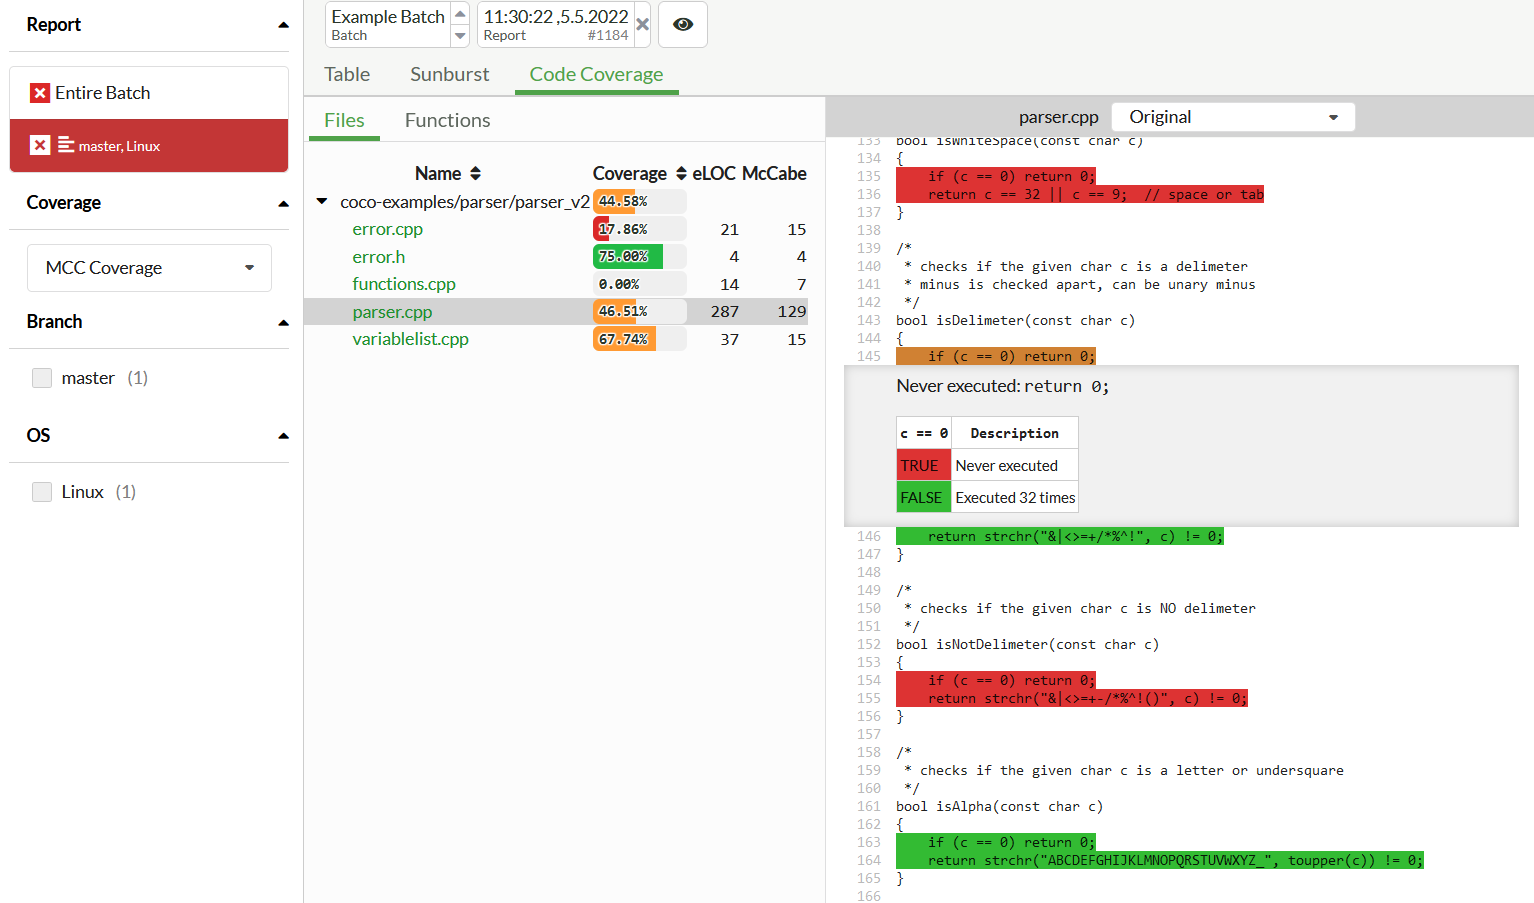
Code Coverage View
The Code Coverage view displays source file hierarchy, together with the coverage, eLOC, and McCabe complexity of each file. To switch to a class and function hierarchy, select the Files or Functions tab. Select a file or function to open its highlighted source code on the right (or below on narrow screens). Click any of the highlighted lines in the source code to toggle an inline tooltip containing further explanations, user comments, or truth tables for decisions or conditions.
The color palette used for highlighting matches the one used by Coco's coverage browser and reports. Choose a coverage method to highlight the relevant coverage. You can switch between viewing the Original and Pre-processed source code.
Test filters
The list of tests displayed in the tests table depends on the selected breadcrumb, granularity, labels, and view modes. For example, a test suite may have different test cases depending on which labels are selected. Also, the list of test cases changes when you add or remove tests.
Use the Tests filter selection dropdown to filter tests:
- All shows all tests that have been executed in the currently selected batch.
- With Failures shows only tests that contain failures in the currently selected batch.
- With new Failures shows only tests that contain failures in the currently selected batch, but succeeded in the previous batch.
- Not Executed shows all tests that have not been executed in the reports determined by the current batch and label selection.
© 2024 The Qt Company Ltd.
Documentation contributions included herein are the copyrights of
their respective owners.
The documentation provided herein is licensed under the terms of the GNU Free Documentation License version 1.3 as published by the Free Software Foundation.
Qt and respective logos are trademarks of The Qt Company Ltd. in Finland and/or other countries worldwide. All other trademarks are property
of their respective owners.
