Dashboard
Signing into Test Center brings you to the dashboard of the program, which is a customizable overview of your server.
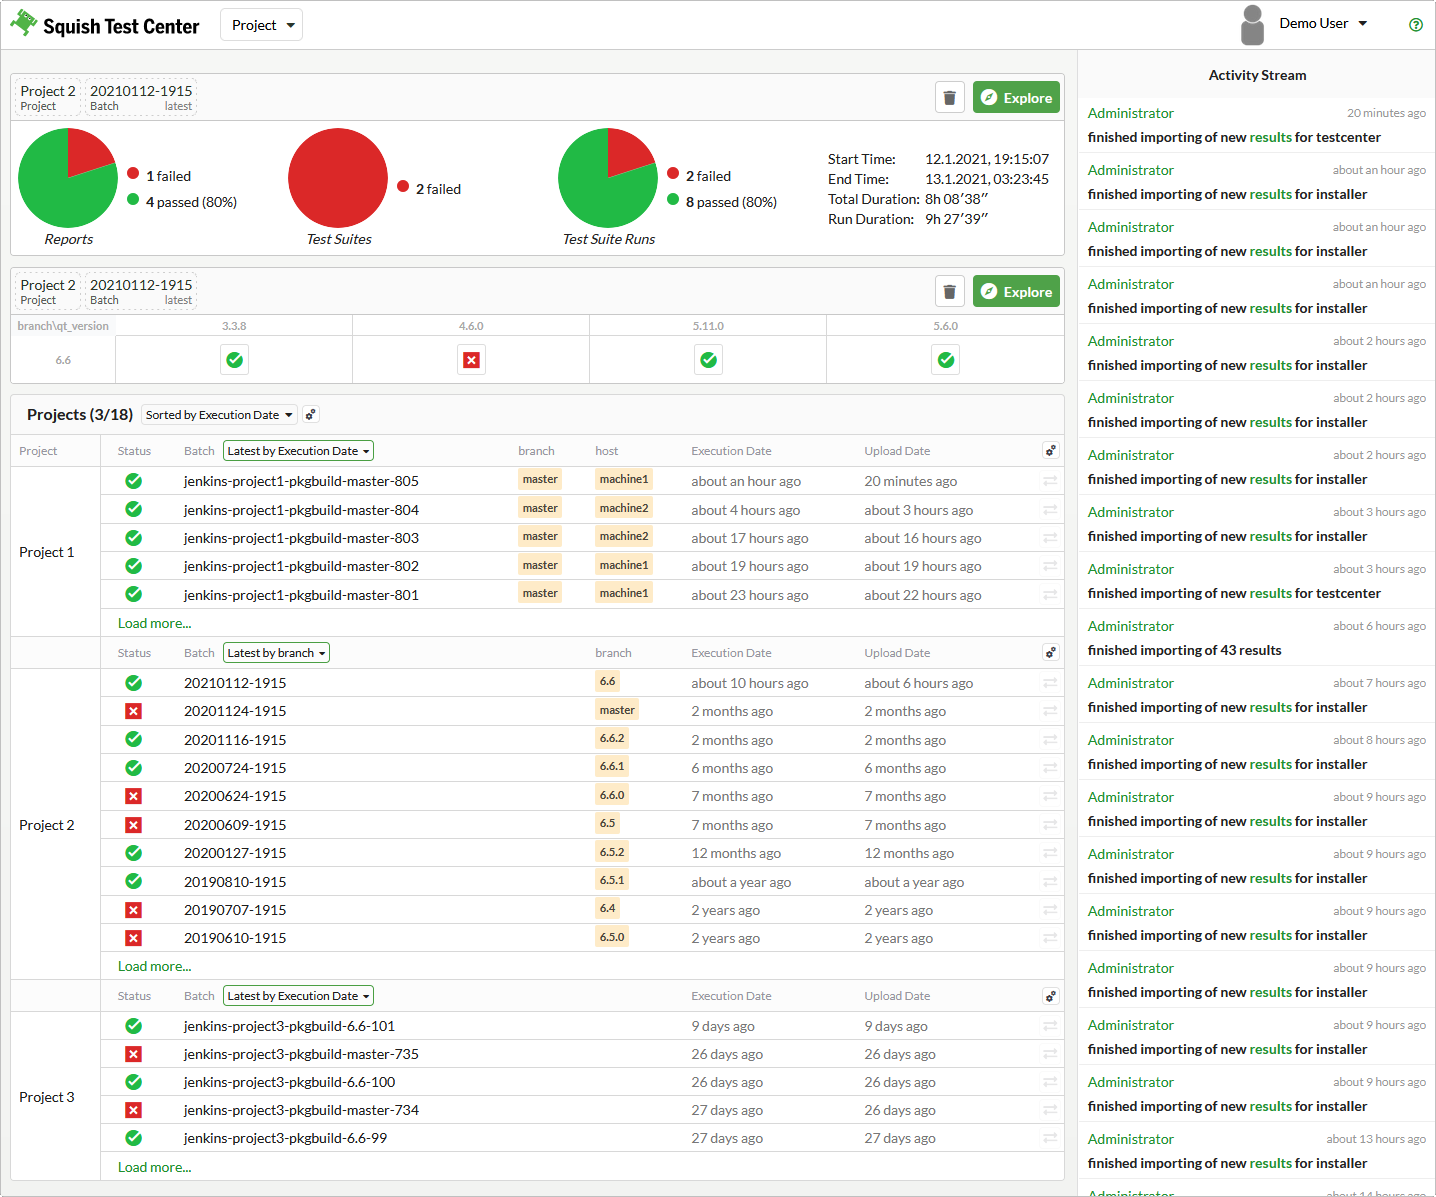
Dashboard with Projects List
Activity Stream
The Activity Stream section provides a compressed view of recent activity, including result uploads and new users.
Bookmarks
Bookmark section
The bookmark section might be empty when you start to use Test Center. It provides quick access to specific views that you find important. You can use the Add to Front Page button in the Batch view to add a small summary of the currently configured view to the bookmark section. You can add the following summaries:
- Test items table
Shows a result summary for the test items shown in the Explore view.
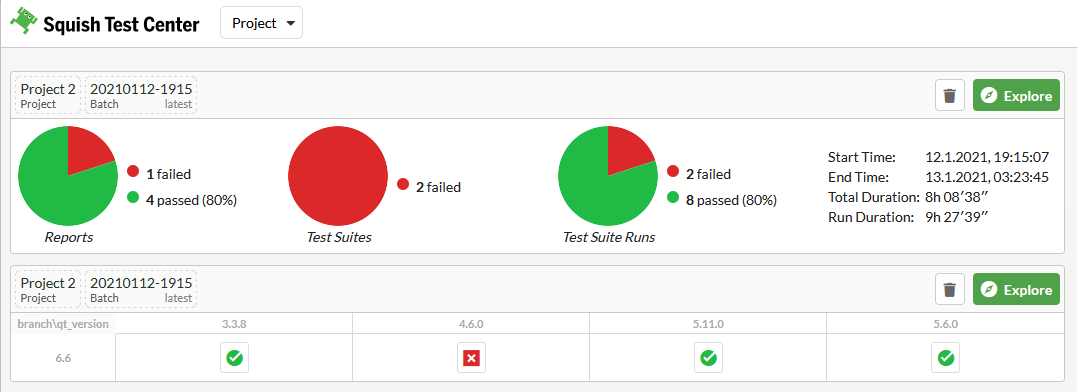
- Pie charts summary
Adds the entire summary section of the Explore view to the dashboard. It contains three pie charts that show the number of passed Reports, Test Suites, and Test Suite Runs.
- Results summary
Shows the overall test result as well as a textual summary of the number of passed and failed Reports and Tests.
Projects
The Projects table provides a summarized overview of the most recent results in all of your projects.
You can sort your projects by Execution Date to place the project with the most recent test execution on top, Upload Date to place the project with the most recent result upload on top, or by Alphabet to place the projects in alphabetic order. Further, you can click the  (Select displayed projects) button to filter out projects that are not relevant to you.
By default, the project overview is configured to show you the latest 5 batches for each project. For each batch, you can see whether it passed or failed, the batch name, the execution date, and the upload date. Use the dropdown menu above the Batch column to sort latest batches by Execution Date or Upload Date or by any labels that you might have assigned during result upload. Sort by label to get the latest test result for each label value. For example, if you upload results for multiple branches, you can sort by label to see the most recent result for each branch.
The button on the heading row for each Project section opens a menu that lets you configure the number of results to display for each project and the visible columns based on the labels you have assigned to your uploaded results.
The Projects table also offers quick access to the comparison functionality. Use the compare buttons in the rightmost column to select two batches for comparison.
Select a project to open the History view of the Test Center's project details page, which also contains a link to the Explore view.
© 2024 The Qt Company Ltd.
Documentation contributions included herein are the copyrights of
their respective owners.
The documentation provided herein is licensed under the terms of the GNU Free Documentation License version 1.3 as published by the Free Software Foundation.
Qt and respective logos are trademarks of The Qt Company Ltd. in Finland and/or other countries worldwide. All other trademarks are property
of their respective owners.
