History
The History view enables you to navigate to a specific point in time and to analyze the results or accumulations of results for a specific range, starting at the specified point in time.
The breadcrumbs bar at the top of the History view and the test-structure navigation work in the same way as in the Explore view. Also, you can filter the selection using labels, just like in the Explore view.
History View
The History view contains the Timeline, Stats and Graphs views.
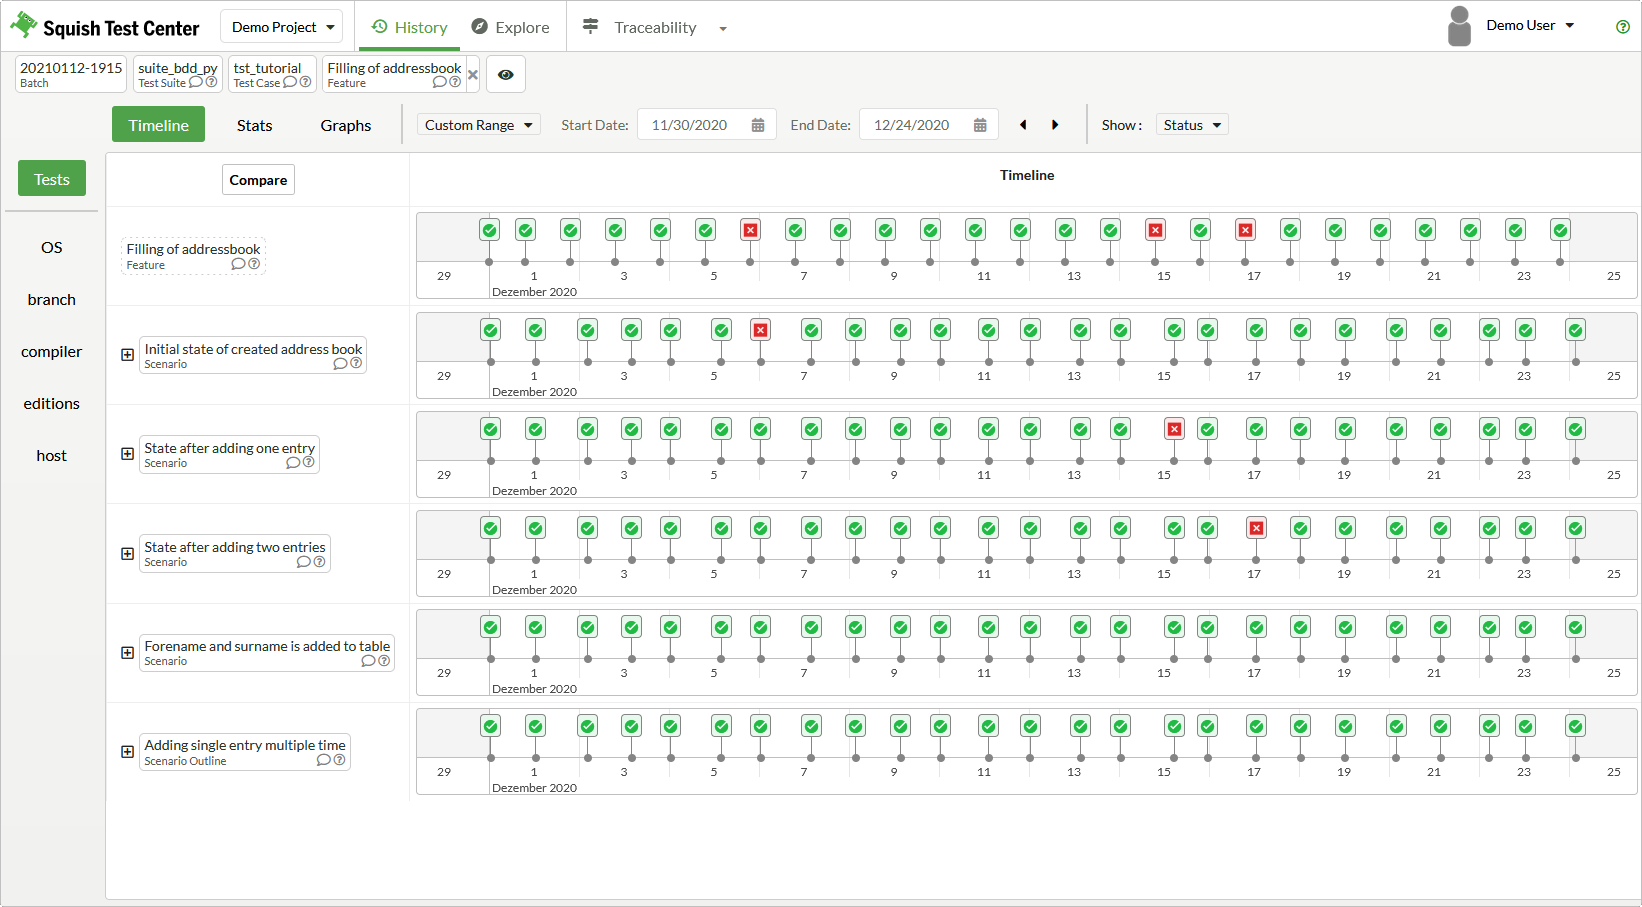
Timeline
You can configure the time frame shown for each section. You can choose one of the following preconfigured time frames: Today, Yesterday, Last 24 Hours, This Week, Last Week, Last 7 Days, This Month, Last Month, Last 30 Days, Last 10 Batches. Or, select Custom Range and pick a Start Date and an End Date. You can shift any of the selected time frames by using the left and right buttons.
The Timeline shows a status icon representing each batch, for the selected time frame. The status indicates whether the batch was passed ( PASS ), failed (
 FAIL ), was annotated as an unexpected pass (
 XPASS ), or was annotated as an expected failure (
 XFAIL ). Click the icons to open the Explore view for details of the test execution.
You can click on the Show dropdown, to show a label value, annotations or code coverage of each batch.
Stats
Stats presents various statistics on a test. All metrics ignore retried and skipped tests.
The metrics are defined as follows:
- Flakiness: Measures test stability in terms of state changes (pass –> fail, fail –> pass) and based on the number of executions. Given N runs and M times the result changes state in either direction, the flakiness is M/N.
- Success Rate: Given number of passed runs P and total number of runs N, the success rate is P/N.
- Times broken: Indicates the number of times a failure occurred, not necessarily the number of incurred failures.
- Annotations: Each annotation type found is shown as a column. Each column indicates the number, of that specific annotation, found. See Annotations.
- Retry Count: Total number of times a test was retried.
- Skip rate: Given number of skipped runs S and total number of runs N, the skip rate is S/N.
- Average Duration: Lists the suite's runtime, averaged against all test executions within the specified time period.
- Average time to fix after failure: Shows the average time until the tests recovered to a passing state.
- Average runs between fixes: Shows the average number of runs until the tests recovered to a passing state.
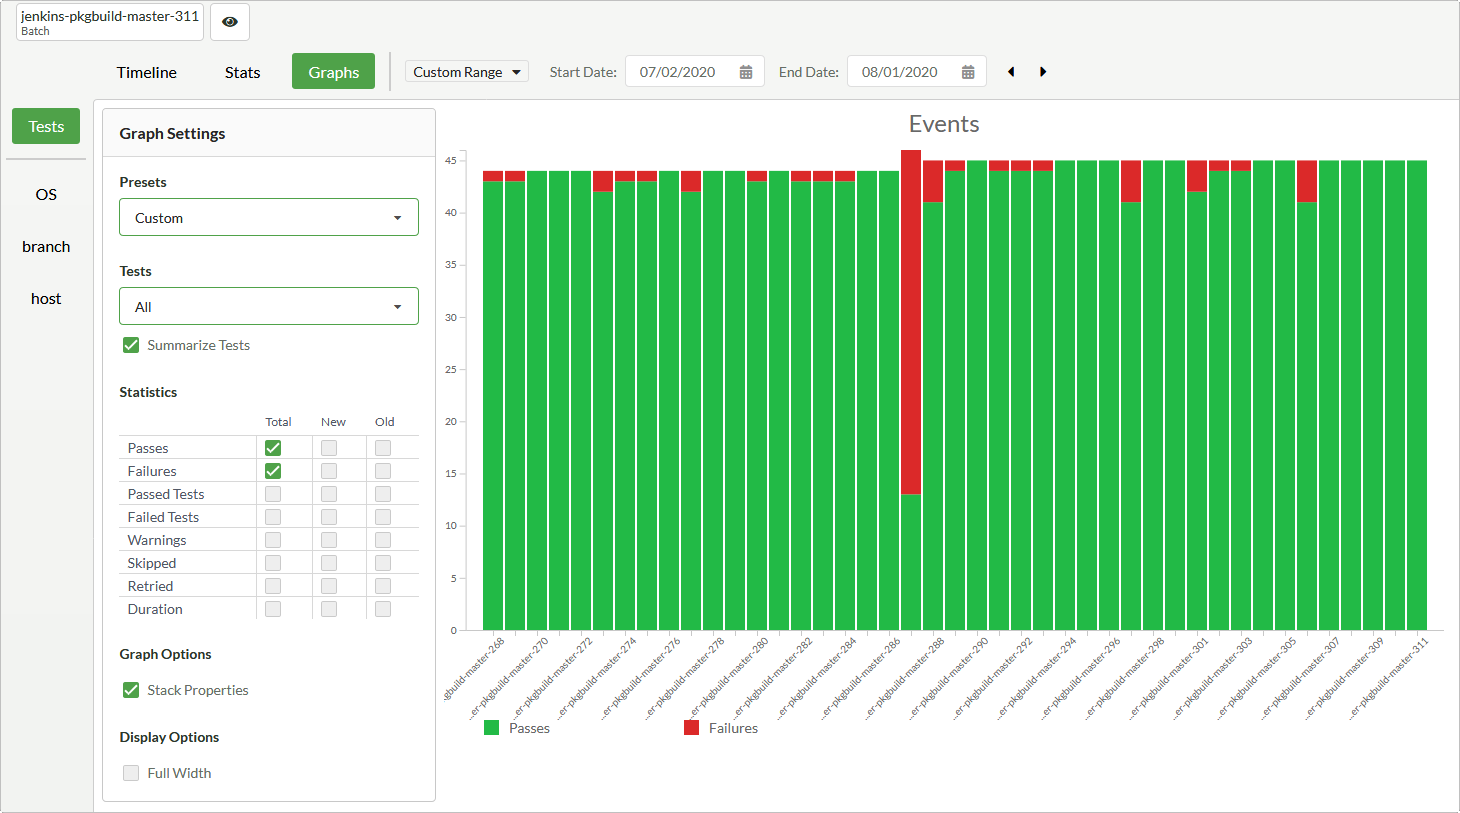
Graphs
The Graphs view contains graphs for many test properties. In Presets, select a predefined graph, such as Total Passes and Failures or Test Duration By Tests. To configure a custom graph, select Custom, and then select test properties in Tests Statistics. The available test properties include Passes, Failures, Passed Tests, Failed Tests, Warnings, Skips, Retries and Duration.
Select Summarize Tests or Summarize Labels to summarize the property values of all currently selected tests or labels. When this option is disabled, each test or label is denoted separately in the graph.
Graphs View
Compare
In Timeline, click Compare to select two batches to compare. Click the boxes of a timeline to change the selected batch. For convenience, the active batch selection dropdown alternates after each selection.

Selecting batches for comparison
Click Compare Selected to open the Compare view.
Click Cancel to exit the compare mode.
The Compare view has a test run selection list for the batches that you selected in the Timeline view compare mode and a side-by-side comparison of two runs. The side-by-side comparison shows child tests or test verifications and logs, depending on the granularity of the History view compare selection. On the left, the test run selected in the upper batch and on the right the selected lower batch.
If you enter a common child test, the comparison changes for only that child test. Clicking a breadcrumb element shows the comparison of a common parent test.
Code Coverage
To see Coco coverage information in the Timeline view, select Coverage from the Show item content selector above the timeline. Coverage percentages show up next to the status symbols representing the batches inside the timeline. For batches containing multiple coverage reports, the coverage values are concatenated.
In Coverage in the filter pane on the left, select the coverage method: function, line, statement (block), decision, condition, MC/DC, or MCC.
The Graphs view allows you to inspect coverage values over time. In Graph Settings, you can select and combine coverage values for each of the above mentioned coverage methods. You cannot select both coverage statistics and test statistics at the same time.
Note: Test Center only shows coverage over time in the graphs if it can identify a single relevant coverage report for each batch. This means either a single uploaded coverage report per batch or a selected set of labels (in the left-hand filter pane) that filters for a single coverage report for each batch.
© 2024 The Qt Company Ltd.
Documentation contributions included herein are the copyrights of
their respective owners.
The documentation provided herein is licensed under the terms of the GNU Free Documentation License version 1.3 as published by the Free Software Foundation.
Qt and respective logos are trademarks of The Qt Company Ltd. in Finland and/or other countries worldwide. All other trademarks are property
of their respective owners.
