QPolarChart Class
QPolarChartは、極座標でデータを表示します。詳細...
| Header: | #include <QPolarChart> |
| Inherits: | QChart |
パブリック型
| enum | PolarOrientation { PolarOrientationRadial, PolarOrientationAngular } |
| flags | PolarOrientations |
パブリック関数
| QPolarChart(QGraphicsItem *parent = nullptr, Qt::WindowFlags wFlags = Qt::WindowFlags()) | |
| virtual | ~QPolarChart() |
| void | addAxis(QAbstractAxis *axis, QPolarChart::PolarOrientation polarOrientation) |
| QList<QAbstractAxis *> | axes(QPolarChart::PolarOrientations polarOrientation = PolarOrientations(PolarOrientationRadial | PolarOrientationAngular), QAbstractSeries *series = nullptr) const |
静的パブリックメンバー
| QPolarChart::PolarOrientation | axisPolarOrientation(QAbstractAxis *axis) |
詳しい説明
極座標チャートはデータを円形のグラフで表示し、データの配置はグラフの中心である極からの角度と距離に基づいている。
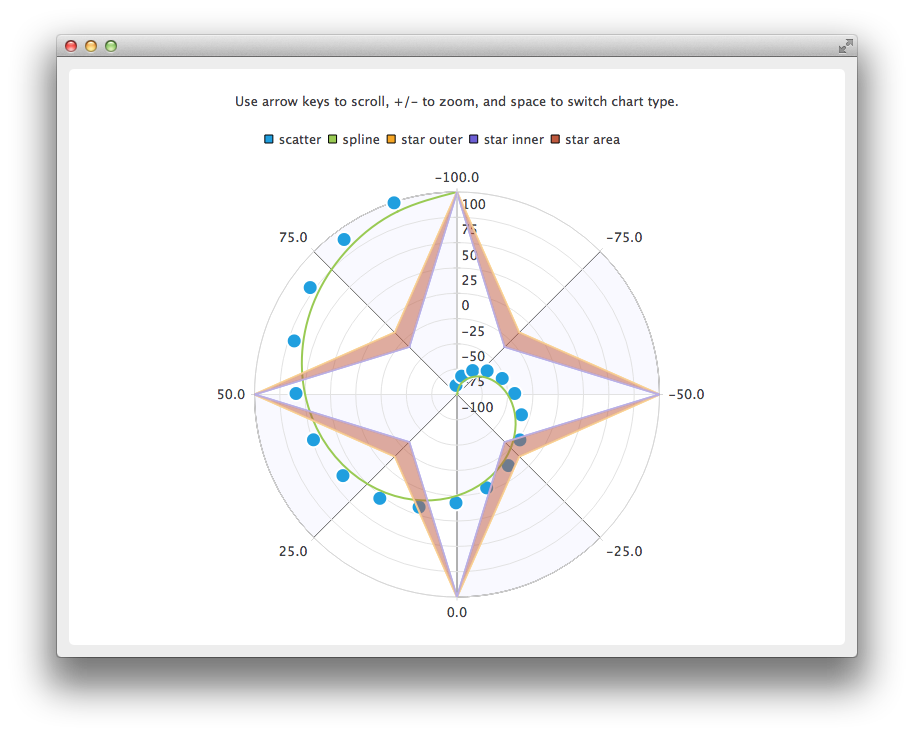
極座標チャートは、QChart の特殊化で、折れ線、スプライン、面積、散布の系列と、それらでサポートされるすべての軸タイプをサポートします。各軸は半径軸としても角度軸としても使える。
角度軸QValueAxis の最初と最後の目盛りは、0/360度の角度で同位置にあります。
連続する2点間の角度距離が180度以上の場合、その2点を結ぶ直線は意味をなさなくなり、引かれなくなる。その代わり、チャートの中心を往復する線が引かれる。したがって、折れ線、スプライン、面積の系列を表示するときは、軸の範囲を適宜選択しなければならない。
ポーラー・チャートは、同じ向きの軸をすべて同じ位置に描くので、グリッドをカスタマイズするためだけに余分な軸を使うのでなければ、同じ向きの軸を複数使うと混乱することがある。たとえば、ハイライトされた範囲を二次的な陰影のあるQCategoryAxis で表示したり、ラベルのない小目盛りを、隠れたラベルのある二次的なQValueAxis で表示することができる。
QChartも参照 。
メンバ型ドキュメント
enum QPolarChart::PolarOrientation
flags QPolarChart::PolarOrientations
この enum 型は、軸の極方位を指定します。
| 定数 | 値 | 説明 |
|---|---|---|
QPolarChart::PolarOrientationRadial | 0x1 | 半径軸、値が極から始まるチャートの半径に沿って配置される。 |
QPolarChart::PolarOrientationAngular | 0x2 | 角軸、値がグラフの周りに配置される。 |
PolarOrientations型は,QFlags<PolarOrientation>の型定義である.PolarOrientationの値のORの組み合わせを格納する。
メンバー関数ドキュメント
[explicit] QPolarChart::QPolarChart(QGraphicsItem *parent = nullptr, Qt::WindowFlags wFlags = Qt::WindowFlags())
parent の子として極線図を構築する。wFlags で指定されたプロパティは、QChart コンストラクタに渡される。
[virtual noexcept] QPolarChart::~QPolarChart()
極チャートオブジェクトと、それに追加された系列オブジェクトや軸オブジェクトなどの子オブジェクトを削除します。
void QPolarChart::addAxis(QAbstractAxis *axis, QPolarChart::PolarOrientation polarOrientation)
この便利なメソッドは、軸axis を極方位polarOrientation を持つ極座標チャートに追加する。チャートは軸の所有権を持つ。
注意: 軸は、QChart::addAxis() でも極座標チャートに追加できる。指定されたアライメントは、極軸の向きを決定する:水平アライメントは角度軸を示し、垂直アライメントは半径軸を示す。
QChart::removeAxis(),QChart::createDefaultAxes(),QAbstractSeries::attachAxis(),QChart::addAxis()も参照 。
QList<QAbstractAxis *> QPolarChart::axes(QPolarChart::PolarOrientations polarOrientation = PolarOrientations(PolarOrientationRadial | PolarOrientationAngular), QAbstractSeries *series = nullptr) const
極方位polarOrientation を持つ系列series に対して追加された軸を返す。系列が提供されない場合は、指定された極方位を持つ任意の軸が返されます。
addAxis()も参照 。
[static] QPolarChart::PolarOrientation QPolarChart::axisPolarOrientation(QAbstractAxis *axis)
極座標チャートの角度軸は水平方位を報告し、半径軸は垂直方位を報告する。この関数は、軸axis の向きを対応する極座標の向きに変換するための便利な関数である。axis がNULLであるか、極座標に追加されていない場合、戻り値は無意味である。
© 2026 The Qt Company Ltd. Documentation contributions included herein are the copyrights of their respective owners. The documentation provided herein is licensed under the terms of the GNU Free Documentation License version 1.3 as published by the Free Software Foundation. Qt and respective logos are trademarks of The Qt Company Ltd. in Finland and/or other countries worldwide. All other trademarks are property of their respective owners.
