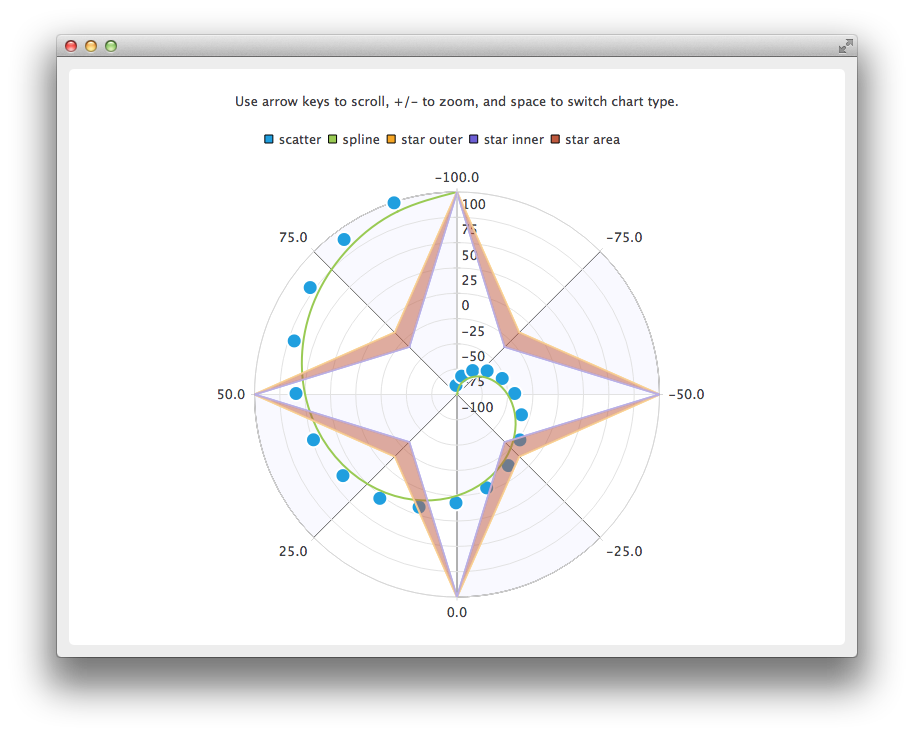
極座標の作成
注: これはCharts with Widgets Galleryの例の一部です。
また、極座標チャートのスクロールとズームの実装方法と、極座標チャートとデカルトチャートがどのように関連しているかを視覚的に示しています。

極座標チャートの作成は、QChart インスタンスではなく、QPolarChart インスタンスで行います。
auto chart = new QPolarChart;
軸の作成は、デカルト・チャートと同様ですが、チャートに軸を追加するとき、アラインメントの代わりに極座標を使うことができます。
auto angularAxis = new QValueAxis;
angularAxis->setTickCount(9); // First and last ticks are co-located on 0/360 angle.
angularAxis->setLabelFormat("%.1f");
angularAxis->setShadesVisible(true);
angularAxis->setShadesBrush(QBrush(QColor(249, 249, 255)));
chart->addAxis(angularAxis, QPolarChart::PolarOrientationAngular);

auto radialAxis = new QValueAxis;
radialAxis->setTickCount(9);
radialAxis->setLabelFormat("%d");
chart->addAxis(radialAxis, QPolarChart::PolarOrientationRadial);
極座標チャートのズームとスクロールは、論理的にはデカルト・チャートのズームとスクロールとほぼ同じである。主な違いは、X軸(角度軸)に沿ってスクロールするとき、ピクセル数の代わりに角度が使われることである。もうひとつの違いは、矩形へのズームができないことである。
void PolarChartView::keyPressEvent(QKeyEvent *event)
{
    switch (event->key()) {
    case Qt::Key_Plus:
        chart()->zoomIn();
        break;
    case Qt::Key_Minus:
        chart()->zoomOut();
        break;
    case Qt::Key_Left:
        chart()->scroll(-1.0, 0);
        break;
    case Qt::Key_Right:
        chart()->scroll(1.0, 0);
        break;
    case Qt::Key_Up:
        chart()->scroll(0, 1.0);
        break;
    case Qt::Key_Down:
        chart()->scroll(0, -1.0);
        break;
    case Qt::Key_Space:
        switchChartType();
        break;
    default:
        QGraphicsView::keyPressEvent(event);
        break;
    }
}
同じ軸と系列を、同時にではないが、デカルト・チャートとポーラー・チャートの両方で使うことができる。チャートの種類を切り替えるには、まず古いチャートから系列と軸を削除し、新しいチャートにそれらを追加する必要がある。軸の範囲を保持したい場合は、それらもコピーする必要がある。
void PolarChartView::switchChartType()
{
    QChart *newChart;
    QChart *oldChart = chart();

    if (oldChart->chartType() == QChart::ChartTypeCartesian)
        newChart = new QPolarChart;
    else
        newChart = new QChart;

    // Move series and axes from old chart to new one
    const QList<QAbstractSeries *> seriesList = oldChart->series();
    const QList<QAbstractAxis *> axisList = oldChart->axes();
    QList<QPair<qreal, qreal> > axisRanges;

    for (QAbstractAxis *axis : axisList) {
        auto valueAxis = static_cast<QValueAxis *>(axis);
        axisRanges.append(QPair<qreal, qreal>(valueAxis->min(), valueAxis->max()));
    }

    for (QAbstractSeries *series : seriesList)
        oldChart->removeSeries(series);

    for (QAbstractAxis *axis : axisList) {
        oldChart->removeAxis(axis);
        newChart->addAxis(axis, axis->alignment());
    }

    for (QAbstractSeries *series : seriesList) {
        newChart->addSeries(series);
        for (QAbstractAxis *axis : axisList)
            series->attachAxis(axis);
    }

    int count = 0;
    for (QAbstractAxis *axis : axisList) {
        axis->setRange(axisRanges[count].first, axisRanges[count].second);
        count++;
    }

    newChart->setTitle(oldChart->title());
    setChart(newChart);
    delete oldChart;
}
© 2025 The Qt Company Ltd. Documentation contributions included herein are the copyrights of their respective owners. The documentation provided herein is licensed under the terms of the GNU Free Documentation License version 1.3 as published by the Free Software Foundation. Qt and respective logos are trademarks of The Qt Company Ltd. in Finland and/or other countries worldwide. All other trademarks are property of their respective owners.

