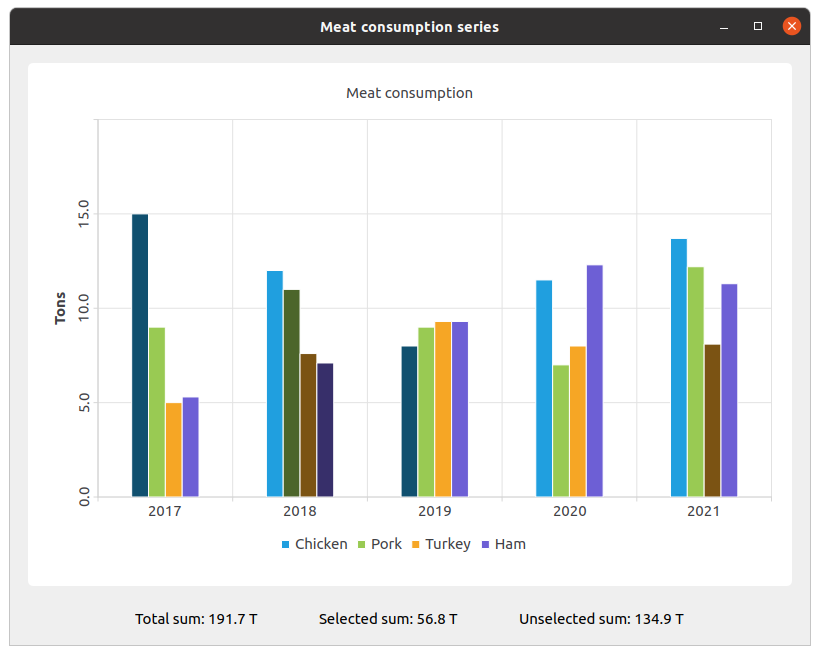
バーの色と状態を変更する
注: これは、Charts with Widgets Galleryの例の一部です。
この例では、setBarSelected() を使用して、バーの色と状態を変更する方法を示します。

セットを作成し、それらをデータで埋めます。それから系列を作成し、それにデータを追加します。
QBarSet *setChicken = createChickenSet();
QBarSet *setPork = createPorkSet();
QBarSet *setTurkey = createTurkeySet();
QBarSet *setHam = createHamSet();
qreal totalSum = setChicken->sum() + setPork->sum() + setTurkey->sum() + setHam->sum();
QList<QBarSet *> setList = QList<QBarSet *>{setChicken, setPork, setTurkey, setHam};

auto series = new QBarSeries;
series->append(setList);
チャートを作成し、そこに系列を追加する。また、チャートにタイトルを追加し、チャートにアニメーションを設定し、凡例を配置します。
auto chart = new QChart;
chart->addSeries(series);
chart->setTitle(tr("Meat Consumption (Click on bars to select them)"));
chart->setAnimationOptions(QChart::SeriesAnimations);
chart->legend()->setVisible(true);
chart->legend()->setAlignment(Qt::AlignBottom);
chart->layout()->setContentsMargins(0, 0, 0, 0);
ここでは、選択されたバーの色を設定します。
const auto barSets = series->barSets();
for (QBarSet *barSet : barSets)
    barSet->setSelectedColor(barSet->brush().color().darker());
次のステップは軸の追加です:QBarCategoryAxis は測定年数、QValueAxis は値域です。
QStringList categories = createYearCategories();
auto axisX = new QBarCategoryAxis;
axisX->setCategories(categories);
chart->addAxis(axisX, Qt::AlignBottom);
series->attachAxis(axisX);

auto axisY = new QValueAxis;
axisY->setRange(0, 20);
axisY->setTitleText(tr("Tons"));
axisY->setLabelsAngle(-90);
axisY->setTitleVisible(true);
chart->addAxis(axisY, Qt::AlignLeft);
series->attachAxis(axisY);
そして、チャートを置くためのチャート・ビューを追加します。
auto chartView = new QChartView(chart, this);
chartView->setRenderHint(QPainter::Antialiasing);
ここでは、選択されたバーと選択されていないバーの値のラベルのためのウィジェットを作成します。
auto labelWidget = new QWidget(this);
auto labelLayout = new QHBoxLayout(labelWidget);
labelLayout->setAlignment(Qt::AlignCenter);

auto totalSumLabel = new QLabel(tr("Total sum: %1 T").arg(totalSum), this);
labelLayout->addWidget(totalSumLabel);
totalSumLabel->setContentsMargins(0, 0, 54, 0);

auto selectedSumLabel = new QLabel(tr("Selected sum: 0 T"), this);
labelLayout->addWidget(selectedSumLabel);

auto unselectedSumLabel = new QLabel(tr("Unselected sum: %1 T").arg(totalSum), this);
labelLayout->addWidget(unselectedSumLabel);
unselectedSumLabel->setContentsMargins(54, 0, 0, 0);
set->toggleSelection({index}) は選択されたバーを設定します。
QObject::connect(series, &QAbstractBarSeries::clicked, series, [=](int index, QBarSet *set) {
    set->toggleSelection({index});
    qreal selectedSum = 0.;
    for (int i = 0; i < setList.size(); ++i) {
        auto selectedIndices = setList.at(i)->selectedBars();
        for (int k = 0; k < selectedIndices.size(); ++k)
            selectedSum += setList.at(i)->at(selectedIndices.at(k));
    }
    selectedSumLabel->setText(tr("Selected sum: %1 T").arg(selectedSum));
    // Because of rounding errors, selectedSum can result in being bigger than total sum
    qreal unselectedSum = totalSum - selectedSum < 0 ? 0. : totalSum - selectedSum;
    unselectedSumLabel->setText(
        tr("Unselected sum: %1 T")
            .arg(unselectedSum)
        );
});
最後に、メイン・レイアウトを作成します。
auto mainLayout = new QVBoxLayout(this);

mainLayout->addWidget(chartView);
mainLayout->addWidget(labelWidget);
© 2025 The Qt Company Ltd. Documentation contributions included herein are the copyrights of their respective owners. The documentation provided herein is licensed under the terms of the GNU Free Documentation License version 1.3 as published by the Free Software Foundation. Qt and respective logos are trademarks of The Qt Company Ltd. in Finland and/or other countries worldwide. All other trademarks are property of their respective owners.

