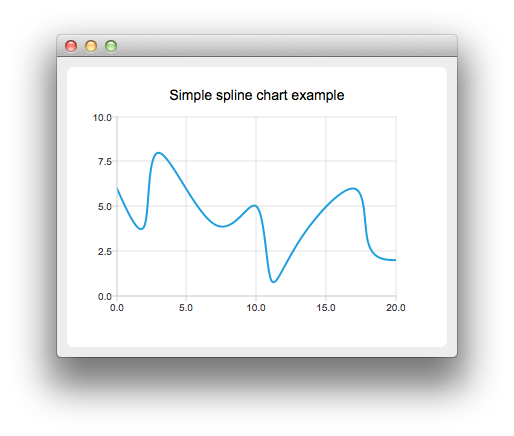
スプライン・チャートの作成

スプライン・チャートを作成するには、QSplineSeries にデータを入れる必要がある。QSplineSeries は、スプラインを適切に描くために必要なスプライン・セグメント制御点を自動的に計算する。
auto series = new QSplineSeries;
series->setName("Spline");
では、データ・ポイントを系列に追加してみよう。
series->append(0, 6);
series->append(2, 4);
series->append(3, 8);
series->append(7, 4);
series->append(10, 5);
*series << QPointF(11, 1) << QPointF(13, 3) << QPointF(17, 6) << QPointF(18, 3) << QPointF(20, 2);
データ系列が入力されました。これをチャートに表示するために、QChart オブジェクトを作成し、そこにデータ系列を追加します。チャートの見やすさをよくするために、タイトルとY軸の値域も設定します。
auto chart = new QChart;
chart->legend()->hide();
chart->addSeries(series);
chart->setTitle("Simple Spline Chart");
chart->createDefaultAxes();
chart->axes(Qt::Vertical).first()->setRange(0, 10);
それからQChart をパラメータとしてQChartView オブジェクトを作成します。こうすることで、QGraphicsView シーンを作成する必要がなくなります。
createDefaultChartView(chart);
© 2025 The Qt Company Ltd. Documentation contributions included herein are the copyrights of their respective owners. The documentation provided herein is licensed under the terms of the GNU Free Documentation License version 1.3 as published by the Free Software Foundation. Qt and respective logos are trademarks of The Qt Company Ltd. in Finland and/or other countries worldwide. All other trademarks are property of their respective owners.

