MapItemView トランジション (QML)
トランジションとMapItemView の併用方法について説明します。

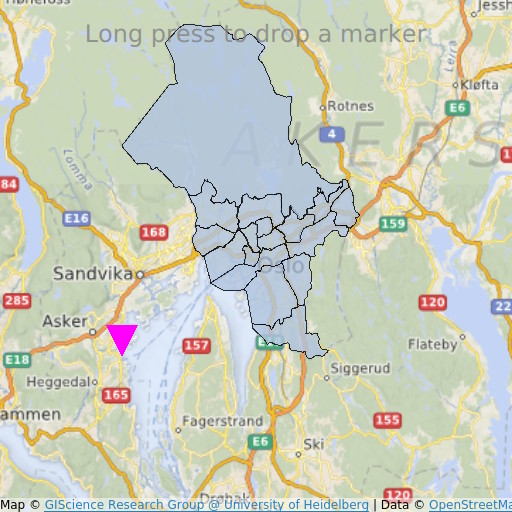
MapItemView TransitionsはMap アイテムを使ってマップを表示する方法を示しています。マップを表示するために必要な最小限のコードを示しており、さらなる実験の基礎として使うことができます。
例の実行
から例を実行するには Qt Creatorからサンプルを実行するには、Welcome モードを開き、Examples からサンプルを選択します。詳しくはQt Creator: チュートリアルを参照:ビルドと実行
QMLコード
main.qml では、2つの MapItemViewオスロ地域の行政区をマップに追加するためと、長押しでマーカーを追加するためです。
MapItemView {
    id: mivMarker

    add: Transition {
        NumberAnimation {
            property: "slideIn"
            from: 50
            to: 0
            duration: 500
            easing.type: Easing.OutBounce
            easing.amplitude: 3.0
        }
    }

    remove: Transition {
        NumberAnimation {
            property: "opacity"
            to: 0.1
            duration: 50
        }
    }

    model: ListModel {
        id: markerModel
    }
    delegate: Component {
        MapQuickItem {
            coordinate: QtPositioning.coordinate(latitude, longitude)
            anchorPoint: Qt.point(e1.width * 0.5, e1.height + slideIn)
            property real slideIn : 0
            sourceItem: Shape {
                id: e1
                vendorExtensionsEnabled: false
                width: 32
                height: 32
                visible: true

                transform: Scale {
                    origin.y: e1.height * 0.5
                    yScale: -1
                }

                ShapePath {
                    id: c_sp1
                    strokeWidth: -1
                    fillColor: Qt.rgba(1,0,1,1.0)

                    property real half: e1.width * 0.5
                    property real quarter: e1.width * 0.25
                    property point center: Qt.point(e1.x + e1.width * 0.5 , e1.y + e1.height * 0.5)

                    property point top: Qt.point(center.x, center.y - half )
                    property point bottomLeft: Qt.point(center.x - half, center.y + half )
                    property point bottomRight: Qt.point(center.x + half, center.y + half )

                    startX: center.x;
                    startY: center.y + half

                    PathLine { x: c_sp1.bottomLeft.x; y: c_sp1.bottomLeft.y }
                    PathLine { x: c_sp1.top.x; y: c_sp1.top.y }
                    PathLine { x: c_sp1.bottomRight.x; y: c_sp1.bottomRight.y }
                    PathLine { x: c_sp1.center.x; y: c_sp1.center.y + c_sp1.half }
                }
            }
        }
    }
}
マーカーのビューでは、追加と削除の両方の遷移を指定し、マーカーが跳ね返るような効果を作り出しています。
MapItemView {
    id: miv
    model: OsloListModel {
        id: osloListModel
    }
    add: Transition {
        NumberAnimation {
            property: "animationScale"
            from: 0.2
            to: 1
            duration: 800
            easing.type: Easing.OutCubic
        }
    }
    delegate: Component {
        MapPolygon {
            function fromMercator(l, centroid) {
                var res = []
                for (var i  = 0; i < l.length; i++) {
                    var vtx = l[i]
                    var offset = Qt.point((vtx.x - centroid.x) * animationScale,
                                          (vtx.y - centroid.y) * animationScale)
                    var pt = Qt.point(centroid.x + offset.x, centroid.y + offset.y)
                    res.push( QtPositioning.mercatorToCoord(pt) )
                }
                return res;
            }

            path: fromMercator(osloListModel.geometries[name+"_"+adminLevel]
                               , osloListModel.centroids[name+"_"+adminLevel] )
            color: ((adminLevel > 4) ? "lightsteelblue" : 'firebrick')
            property real animationScale : 1
            opacity: ((adminLevel < 9) ? 0.1 : 0.8)
            visible: true
        }
    }
}
行政区ビューでは、追加トランジションのみを指定し、行政区の拡大効果を作成します。
必要条件
この例では、OpenStreetMap マップタイルをダウンロードするためのインターネット接続が必要です。オプションのシステムプロキシは自動的にピックアップされるはずです。
© 2025 The Qt Company Ltd. Documentation contributions included herein are the copyrights of their respective owners. The documentation provided herein is licensed under the terms of the GNU Free Documentation License version 1.3 as published by the Free Software Foundation. Qt and respective logos are trademarks of The Qt Company Ltd. in Finland and/or other countries worldwide. All other trademarks are property of their respective owners.

