ScatterSeries QML Type
ScatterSeries 型は、データを散布図で表示します。詳細...
| Import Statement: | import QtGraphs |
| In C++: | QScatterSeries |
| Inherits: |
- 継承メンバを含む全メンバ一覧
- ScatterSeries はQt Graphs QML Types for 2D に含まれます。
プロパティ
- pointDelegate : Component
詳細説明
散布データはグラフ上の点の集まりとして表示される。各ポイントには、横軸と縦軸の位置を決定する 2 つの値が指定されます。
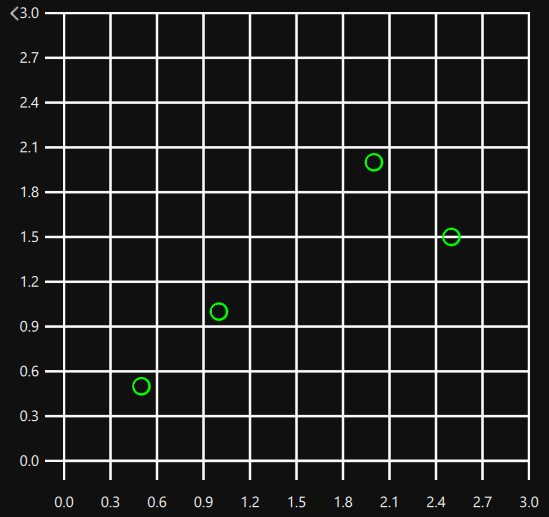
GraphsView 内で ScatterSeries を作成することで、散布データを表現できます。各点の x と y の値を定義する ScatterSeries の子として XYPoints を作成することで、データをグラフに追加できます。
GraphsView {
    anchors.fill: parent
    axisX: ValueAxis {
        max: 3
    }
    axisY: ValueAxis {
        max: 3
    }

    ScatterSeries {
        color: "#00ff00"
        XYPoint { x: 0.5; y: 0.5 }
        XYPoint { x: 1; y: 1 }
        XYPoint { x: 2; y: 2 }
        XYPoint { x: 2.5; y: 1.5 }
    }
}
複数の散布図グラフは、GraphsView の子として複数の ScatterSeries を追加することで作成できます。このような場合、複数の定義は以前のものを上書きするだけなので、使用する軸を定義するのは 1 つの系列だけにします。
GraphsView {
    anchors.fill: parent
    ScatterSeries {
        color: "#00ff00"
        axisX: ValueAxis {
            max: 3
        }
        axisY: ValueAxis {
            max: 3
        }

        XYPoint { x: 0.5; y: 0.5 }
        XYPoint { x: 1; y: 1 }
        XYPoint { x: 2; y: 2 }
        XYPoint { x: 2.5; y: 1.5 }
    }

    ScatterSeries {
        color: "#ff0000"
        XYPoint { x: 0.5; y: 3 }
        XYPoint { x: 1; y: 2 }
        XYPoint { x: 2; y: 2.5 }
        XYPoint { x: 2.5; y: 1 }
    }
}
プロパティのドキュメント
pointDelegate : Component
与えられた QML コンポーネントで点をマークする。
pointDelegate: Image {
    source: "images/happy_box.png"
}
© 2026 The Qt Company Ltd. Documentation contributions included herein are the copyrights of their respective owners. The documentation provided herein is licensed under the terms of the GNU Free Documentation License version 1.3 as published by the Free Software Foundation. Qt and respective logos are trademarks of The Qt Company Ltd. in Finland and/or other countries worldwide. All other trademarks are property of their respective owners.
