軸のハンドリング
QMLのカスタム入力ハンドラによる軸ドラッグの実装と、カスタム軸フォーマッタの作成。
Axis Handlingでは、軸を使った2つの異なるカスタム機能を示します。これらの機能には、アプリケーション内に独自のタブがあります。
以下の節では、これらの機能のみに焦点を当て、基本的な機能の説明は省略します - より詳細なQMLサンプルドキュメントについては、単純散布図を参照してください。
例の実行
からサンプルを実行するには Qt Creatorからサンプルを実行するには、Welcome モードを開き、Examples からサンプルを選択します。詳しくはQt Creator: チュートリアルを参照してください:ビルドと実行を参照してください。
軸のドラッグ
Axis Dragging タブでは、軸ラベルをドラッグして軸の範囲を変更できるように、QML でカスタム入力ハンドラを実装します。さらに、正射投影を使用し、カスタム項目のプロパティを動的に更新します。
デフォルト入力処理のオーバーライド
デフォルトの入力処理メカニズムを無効にするには、Scatter3D のデフォルト入力ハンドラの設定を解除してください:
unsetDefaultInputHandler();
...次に、MouseArea を追加し、親を埋めるように設定します。この親は、私たちのscatterGraph が含まれているのと同じItem です。また、この例では他のボタンは必要ないので、マウスの左ボタンが押されたときだけ受け付けるように設定する:
MouseArea {
    anchors.fill: parent
    hoverEnabled: true
    acceptedButtons: Qt.LeftButton
    ...
そして、マウスが押されるのを聞き、キャッチしたらグラフに選択クエリーを送る:
onPressed: (mouse)=> {
               scatterGraph.doPicking(Qt.point(mouse.x, mouse.y));
           }
onPositionChanged シグナル・ハンドラは、移動距離の計算に必要なマウスの現在位置をキャッチする:
onPositionChanged: (mouse)=> {
                       currentMouseX = mouse.x;
                       currentMouseY = mouse.y;
    ...
onPositionChanged の最後に、後で紹介する移動距離計算のために、前のマウス位置を保存する:
...
    previousMouseX = currentMouseX;
    previousMouseY = currentMouseY;
}
マウスの動きを軸の範囲変更に変換する
scatterGraph onSelectedElementChangedこのシグナルは、inputArea のonPressed で選択クエリーが行われた後に発せられます。メイン・コンポーネントで定義したプロパティ(property int selectedAxisLabel: -1 )に要素タイプを設定します:
onSelectedElementChanged: {
    if (selectedElement >= Graphs3D.ElementType.AxisXLabel
            && selectedElement <= Graphs3D.ElementType.AxisZLabel) {
        selectedAxisLabel = selectedElement;
    } else {
        selectedAxisLabel = -1;
    }
}
次に、inputArea のonPositionChanged に戻って、マウス・ボタンが押されているかどうか、および現在の軸ラベルが選択されているかどうかをチェックします。条件が満たされていれば、マウスの動きから軸範囲の更新への変換を行う関数を呼び出します:
...
if (pressed && selectedAxisLabel != -1)
    axisDragView.dragAxis();
...
この場合、カメラの回転は固定されているので、変換は簡単です。いくつかの事前計算された値を使用して、マウス移動距離を計算し、選択された軸範囲に値を適用できます:
function dragAxis() {
    // Do nothing if previous mouse position is uninitialized
    if (previousMouseX === -1)
        return;

    // Directional drag multipliers based on rotation. Camera is locked to 45 degrees, so we
    // can use one precalculated value instead of calculating xx, xy, zx and zy individually
    var cameraMultiplier = 0.70710678;

    // Calculate the mouse move amount
    var moveX = currentMouseX - previousMouseX;
    var moveY = currentMouseY - previousMouseY;

    // Adjust axes
    switch (selectedAxisLabel) {
    case Graphs3D.ElementType.AxisXLabel:
        var distance = ((moveX - moveY) * cameraMultiplier) / dragSpeedModifier;
        // Check if we need to change min or max first to avoid invalid ranges
        if (distance > 0) {
            scatterGraph.axisX.min -= distance;
            scatterGraph.axisX.max -= distance;
        } else {
            scatterGraph.axisX.max -= distance;
            scatterGraph.axisX.min -= distance;
        }
        break;
    case Graphs3D.ElementType.AxisYLabel:
        distance = moveY / dragSpeedModifier;
        // Check if we need to change min or max first to avoid invalid ranges
        if (distance > 0) {
            scatterGraph.axisY.max += distance;
            scatterGraph.axisY.min += distance;
        } else {
            scatterGraph.axisY.min += distance;
            scatterGraph.axisY.max += distance;
        }
        break;
    case Graphs3D.ElementType.AxisZLabel:
        distance = ((moveX + moveY) * cameraMultiplier) / dragSpeedModifier;
        // Check if we need to change min or max first to avoid invalid ranges
        if (distance > 0) {
            scatterGraph.axisZ.max += distance;
            scatterGraph.axisZ.min += distance;
        } else {
            scatterGraph.axisZ.min += distance;
            scatterGraph.axisZ.max += distance;
        }
        break;
    }
}
マウス移動から軸範囲更新へのより高度な変換については、グラフギャラリーを参照してください。
その他の機能
この例では、正投影法を使用する方法と、カスタム項目のプロパティをオンザフライで更新する方法も示しています。
正射投影はとても簡単です。scatterGraph のorthoProjection プロパティを変更するだけです。この例には、オンとオフを切り替えるためのボタンがあります:
Button {
    id: orthoToggle
    width: axisDragView.portraitMode ? parent.width : parent.width / 3
    text: "Display Orthographic"
    anchors.left: axisDragView.portraitMode ? parent.left : rangeToggle.right
    anchors.top: axisDragView.portraitMode ? rangeToggle.bottom : parent.top
    onClicked: {
        if (scatterGraph.orthoProjection) {
            text = "Display Orthographic";
            scatterGraph.orthoProjection = false;
            // Orthographic projection disables shadows, so we need to switch them back on
            scatterGraph.shadowQuality = Graphs3D.ShadowQuality.Medium
        } else {
            text = "Display Perspective";
            scatterGraph.orthoProjection = true;
        }
    }
}
カスタム・アイテムについては、scatterGraph のcustomItemList に追加してください:
customItemList: [
    Custom3DItem {
        id: qtCube
        meshFile: ":/qml/axishandling/cube.mesh"
        textureFile: ":/qml/axishandling/cubetexture.png"
        position: Qt.vector3d(0.65, 0.35, 0.65)
        scaling: Qt.vector3d(0.3, 0.3, 0.3)
    }
]
グラフのすべての項目を追加、削除、回転するタイマーを実装し、カスタム項目の回転にも同じタイマーを使用します:
onTriggered: {
    rotationAngle = rotationAngle + 1;
    qtCube.setRotationAxisAndAngle(Qt.vector3d(1, 0, 1), rotationAngle);
    ...
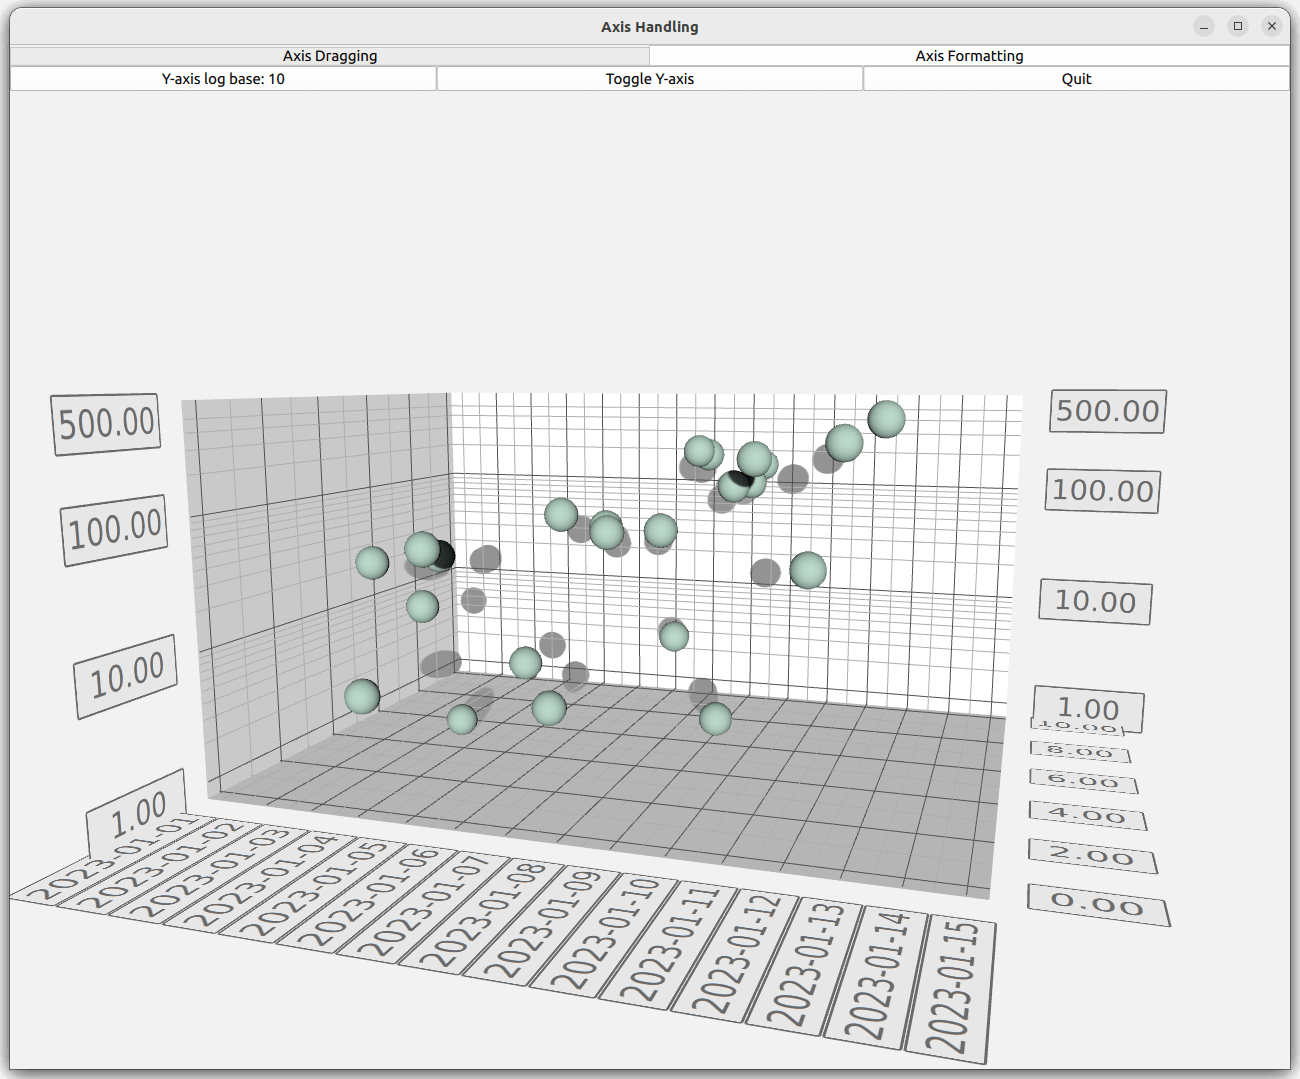
軸フォーマッタ
Axis Formatter タブで、カスタム軸フォーマッタを作成する。また、定義済みの軸フォーマッタを使用する方法も説明します。
カスタム軸フォーマッタ
軸フォーマッタをカスタマイズするには、QValue3DAxisFormatter をサブクラス化する必要がありますが、これは QML コードだけではできません。この例では、軸は浮動小数点値をタイムスタンプとして解釈し、軸ラベルに日付を表示します。これを実現するには、QValue3DAxisFormatter をサブクラス化したCustomFormatter という新しいクラスを導入します:
class CustomFormatter : public QValue3DAxisFormatter
{
...
QScatter3DSeries の float 値は、データ幅が異なるため、QDateTime の値に直接キャストできないので、2 つの間に何らかのマッピングが必要です。マッピングを行うには、フォーマッタに原点となる日付を指定し、QScatter3DSeries の浮動小数点値を、その原点値に対する日付オフセットとして解釈します。原点となる日付はプロパティとして指定します:
Q_PROPERTY(QDate originDate READ originDate WRITE setOriginDate NOTIFY originDateChanged)値からQDateTime へのマッピングには、valueToDateTime() メソッドを使用します:
QDateTime CustomFormatter::valueToDateTime(qreal value) const
{
    return m_originDate.startOfDay().addMSecs(qint64(oneDayMs * value));
}
軸フォーマッタとして機能するために、CustomFormatter はいくつかの仮想メソッドを再実装する必要があります:
QValue3DAxisFormatter *createNewInstance() const override; void populateCopy(QValue3DAxisFormatter ©) override; void recalculate() override; QString stringForValue(qreal value, const QString &format) override;
最初の2つのメソッドは単純で、CustomFormatter の新しいインスタンスを作成し、必要なデータをコピーするだけです。最初の2つのメソッドは単純で、 の新しいインスタンスを作成し、必要なデータをコピーするだけです。これらの2つのメソッドを使用して、レンダリング用にフォーマッタのキャッシュを作成・更新します。populateCopy() のスーパークラス実装を呼び出すことを忘れないでください:
QValue3DAxisFormatter *CustomFormatter::createNewInstance() const { return new CustomFormatter(); } void CustomFormatter::populateCopy(QValue3DAxisFormatter ©) { QValue3DAxisFormatter::populateCopy(copy); CustomFormatter *customFormatter = static_cast<CustomFormatter *>(©); customFormatter->m_originDate = m_originDate; customFormatter->m_selectionFormat = m_selectionFormat; }
CustomFormatter recalculate() メソッドでは、フォーマッタがグリッド、サブグリッド、ラベルの位置を計算し、ラベル文字列をフォーマットします。カスタムフォーマッタでは、軸のセグメントカウントを無視し、常に真夜中にグリッド線を引きます。サブセグメントのカウントとラベルの位置は普通に処理される:
void CustomFormatter::recalculate()
{
    // We want our axis to always have gridlines at date breaks

    // Convert range into QDateTimes
    QDateTime minTime = valueToDateTime(qreal(axis()->min()));
    QDateTime maxTime = valueToDateTime(qreal(axis()->max()));

    // Find out the grid counts
    QTime midnight(0, 0);
    QDateTime minFullDate(minTime.date(), midnight);
    int gridCount = 0;
    if (minFullDate != minTime)
        minFullDate = minFullDate.addDays(1);
    QDateTime maxFullDate(maxTime.date(), midnight);

    gridCount += minFullDate.daysTo(maxFullDate) + 1;
    int subGridCount = axis()->subSegmentCount() - 1;

    QList<float> gridPositions;
    QList<float> subGridPositions;
    QList<float> labelPositions;
    QStringList labelStrings;

    // Reserve space for position arrays and label strings
    gridPositions.resize(gridCount);
    subGridPositions.resize((gridCount + 1) * subGridCount);
    labelPositions.resize(gridCount);
    labelStrings.reserve(gridCount);

    // Calculate positions and format labels
    qint64 startMs = minTime.toMSecsSinceEpoch();
    qint64 endMs = maxTime.toMSecsSinceEpoch();
    qreal dateNormalizer = endMs - startMs;
    qreal firstLineOffset = (minFullDate.toMSecsSinceEpoch() - startMs) / dateNormalizer;
    qreal segmentStep = oneDayMs / dateNormalizer;
    qreal subSegmentStep = 0;
    if (subGridCount > 0)
        subSegmentStep = segmentStep / qreal(subGridCount + 1);

    for (int i = 0; i < gridCount; i++) {
        qreal gridValue = firstLineOffset + (segmentStep * qreal(i));
        gridPositions[i] = float(gridValue);
        labelPositions[i] = float(gridValue);
        labelStrings << minFullDate.addDays(i).toString(axis()->labelFormat());
    }

    for (int i = 0; i <= gridCount; i++) {
        if (subGridPositions.size()) {
            for (int j = 0; j < subGridCount; j++) {
                float position;
                if (i)
                    position = gridPositions.at(i - 1) + subSegmentStep * (j + 1);
                else
                    position = gridPositions.at(0) - segmentStep + subSegmentStep * (j + 1);
                if (position > 1.0f || position < 0.0f)
                    position = gridPositions.at(0);
                subGridPositions[i * subGridCount + j] = position;
            }
        }
    }
    setGridPoitions(gridPositions);
    setSubGridPositions(subGridPositions);
    setlabelPositions(labelPositions);
    setLabelStrings(labelStrings);
}
軸ラベルは、日付のみを表示するようにフォーマットされます。ただし、選択ラベルのタイムスタンプの解像度を上げるには、カスタムフォーマッタに別のプロパティを指定して、ユーザがカスタマイズできるようにします:
Q_PROPERTY(QString selectionFormat READ selectionFormat WRITE setSelectionFormat NOTIFY
selectionFormatChanged)この選択フォーマット・プロパティは、再実装されたstringToValue メソッドで使用されます。このメソッドでは、送信されたフォーマットは無視され、カスタム選択フォーマットが代用されます:
QString CustomFormatter::stringForValue(qreal value, const QString &format)
{
    Q_UNUSED(format);

    return valueToDateTime(value).toString(m_selectionFormat);
}
新しいカスタムフォーマッタをQMLに公開するには、それを宣言してQMLモジュールにしてください。この方法についてはSurface Graph Gallery を参照してください。
QML
QMLのコードでは、それぞれの次元に異なる軸を定義します:
axisZ: valueAxis
axisY: logAxis
axisX: dateAxis
Z軸は通常のValue3DAxis :
Value3DAxis {
    id: valueAxis
    segmentCount: 5
    subSegmentCount: 2
    labelFormat: "%.2f"
    min: 0
    max: 10
}
Y軸には対数軸を定義する。Value3DAxis に対数目盛りを表示させるには、軸のformatter プロパティにLogValue3DAxisFormatter を指定します:
Value3DAxis {
    id: logAxis
    formatter: LogValue3DAxisFormatter {
        id: logAxisFormatter
        base: 10
        autoSubGrid: true
        edgeLabelsVisible: true
    }
    labelFormat: "%.2f"
}
そして最後に、X軸には新しいCustomFormatter を使用します:
Value3DAxis {
    id: dateAxis
    formatter: CustomFormatter {
        originDate: "2023-01-01"
        selectionFormat: "yyyy-MM-dd HH:mm:ss"
    }
    subSegmentCount: 2
    labelFormat: "yyyy-MM-dd"
    min: 0
    max: 14
}
アプリケーションの残りの部分は、軸を修正しグラフを表示するための、かなり自明なロジックで構成されています。
コンテンツ例
© 2026 The Qt Company Ltd. Documentation contributions included herein are the copyrights of their respective owners. The documentation provided herein is licensed under the terms of the GNU Free Documentation License version 1.3 as published by the Free Software Foundation. Qt and respective logos are trademarks of The Qt Company Ltd. in Finland and/or other countries worldwide. All other trademarks are property of their respective owners.
