サーフェスグラフ・ギャラリー
Surface3D グラフの3つの異なる使い方を紹介するギャラリー。
Surface Graph Galleryでは、Surface3D グラフを使った3つの異なるカスタム機能を紹介しています。これらの機能は、アプリケーション内にそれぞれのタブを持っています。
以下の章では、これらの機能のみに焦点を当て、基本的な機能の説明は省略します - より詳細なQMLのサンプルドキュメントについては、単純な散布図を参照してください。
サンプルを実行する
からサンプルを実行するには Qt Creatorからサンプルを実行するには、Welcome モードを開き、Examples からサンプルを選択します。詳しくはQt Creator: チュートリアルを参照してください:ビルドと実行。
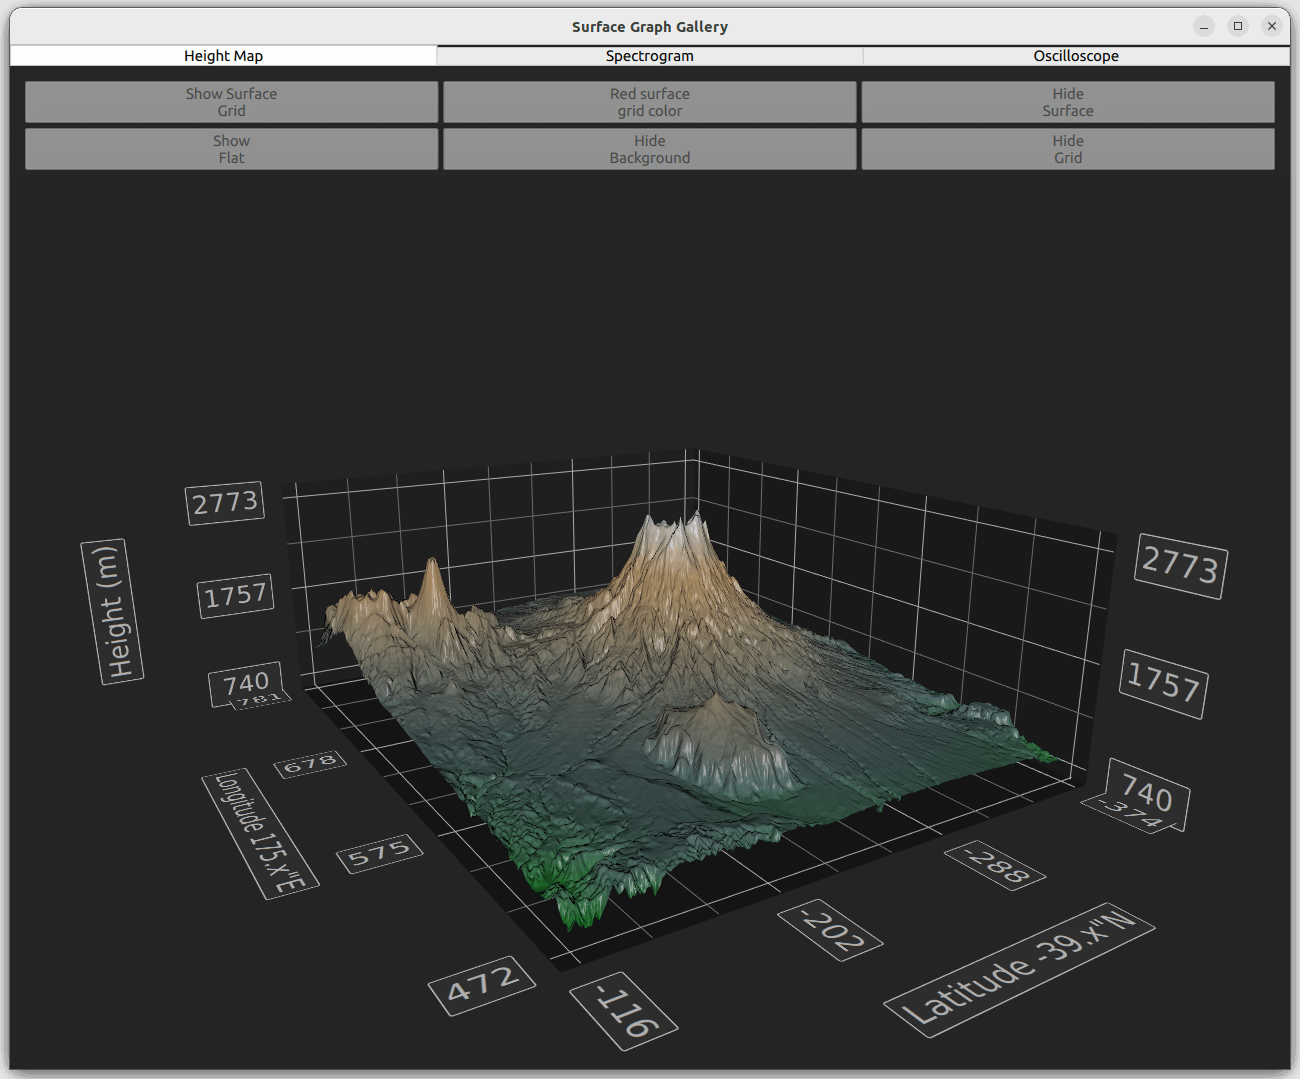
高さマップ
Height Map タブで、高さデータからサーフェスグラフを生成する。使用するデータは、ニュージーランドのルアペフ山とンガウルホー山の高さマップです。
グラフへのデータの追加
高さマップ画像から高さ情報を読み取るHeightMapSurfaceDataProxy を使ってデータを設定します。プロキシ自体はSurface3DSeries に含まれています。HeightMapSurfaceDataProxy 内のheightMapFile プロパティは、高さデータを含む画像ファイルを指定します。プロキシ内の値プロパティは、表面積の幅、奥行き、高さの最小値と最大値を定義します。z とx の値は緯度と経度で、ほぼ実世界の位置にあり、y はメートルです。
注: グラフの縦横比は現実の縮尺には設定されず、代わりに高さが誇張されている。
Surface3DSeries {
    id: heightSeries
    shading: Surface3DSeries.Shading.Smooth
    drawMode: Surface3DSeries.DrawSurface

    HeightMapSurfaceDataProxy {
        heightMapFile: "://qml/surfacegallery/heightmap.png"
        // We don't want the default data values set by heightmap proxy, but use
        // actual coordinate and height values instead
        autoScaleY: true
        minYValue: 740
        maxYValue: 2787
        minZValue: -374 // ~ -39.374411"N
        maxZValue: -116 // ~ -39.115971"N
        minXValue: 472  // ~ 175.471767"E
        maxXValue: 781  // ~ 175.780758"E
    }

    onDrawModeChanged: heightMapView.checkState()
}
データの表示
main.qml で、データを表示するためにSurface3D 要素を設定します。
まず、サーフェスに使用するカスタム・グラデーションを定義します。位置0.0から1.0までの色をGradientで設定し、グラフをより鮮やかにするために2ストップ追加します:
Gradient {
    id: surfaceGradient
    GradientStop { position: 0.0; color: "darkgreen"}
    GradientStop { position: 0.15; color: "darkslategray" }
    GradientStop { position: 0.7; color: "peru" }
    GradientStop { position: 1.0; color: "white" }
}
この要素をSurface3D で使用したtheme のbaseGradients プロパティに設定します:
theme: GraphsTheme {
    colorScheme: GraphsTheme.ColorScheme.Dark
    labelFont.family: "STCaiyun"
    labelFont.pointSize: 35
    colorStyle: GraphsTheme.ColorStyle.ObjectGradient
    baseGradients: [surfaceGradient] // Use the custom gradient
}
ボタンを使って他のSurface3D 機能をコントロールする。
最初のボタンは、サーフェスグリッドのオンとオフを切り替えます。描画モードを完全にクリアすることはできないので、サーフェス自体が表示されていない限り、サーフェスグリッドを非表示にすることはできません:
onClicked: {
    if (heightSeries.drawMode & Surface3DSeries.DrawWireframe)
        heightSeries.drawMode &= ~Surface3DSeries.DrawWireframe;
    else
        heightSeries.drawMode |= Surface3DSeries.DrawWireframe;
}
2番目のボタンはサーフェスグリッドの色を設定します:
onClicked: {
    if (Qt.colorEqual(heightSeries.wireframeColor, "#000000")) {
        heightSeries.wireframeColor = "red";
        text = "Black surface\ngrid color";
    } else {
        heightSeries.wireframeColor = "black";
        text = "Red surface\ngrid color";
    }
}
3番目は、サーフェス描画モードでサーフェスのオン/オフを切り替えます。描画モードを完全にクリアすることはできないので、サーフェスグリッドが表示されていない限り、サーフェス自体を隠すことはできません:
onClicked: {
    if (heightSeries.drawMode & Surface3DSeries.DrawSurface)
        heightSeries.drawMode &= ~Surface3DSeries.DrawSurface;
    else
        heightSeries.drawMode |= Surface3DSeries.DrawSurface;
}
4番目はシェーディングモードを設定します。例をOpenGL ESシステムで実行している場合、フラットシェーディングは使用できません:
onClicked: {
    if (heightSeries.shading === Surface3DSeries.Shading.Flat) {
        heightSeries.shading = Surface3DSeries.Shading.Smooth;
        text = "Show\nFlat"
    } else {
        heightSeries.shading = Surface3DSeries.Shading.Flat;
        text = "Show\nSmooth"
    }
}
残りのボタンは、グラフの背景機能をコントロールします。
スペクトログラム
Spectrogram タブで、極およびデカルトスペクトログラムを表示し、2Dで表示するために正射投影を使用します。
スペクトログラムは、異なる値を強調するために使用される範囲勾配を持つサーフェスグラフです。通常、スペクトログラムは2次元のサーフェスで表示され、グラフのトップダウンの正射投影ビューでシミュレートされます。2D効果を強制するには、正投影モードでマウスまたはタッチによるグラフの回転を無効にします。
スペクトログラムの作成
2D スペクトログラムを作成するには、Surface3DSeries で指定されたデータでSurface3D アイテムをItemModelSurfaceDataProxy で定義します:
Surface3D {
    id: surfaceGraph
    anchors.fill: parent

    // Don't show specular spotlight as we don't want it to distort the colors
    lightStrength: 0.0
    ambientLightStrength: 1.0

    Surface3DSeries {
        id: surfaceSeries
        shading: Surface3DSeries.Shading.Smooth
        drawMode: Surface3DSeries.DrawSurface
        baseGradient: surfaceGradient
        colorStyle: GraphsTheme.ColorStyle.RangeGradient
        itemLabelFormat: "(@xLabel, @zLabel): @yLabel"

        ItemModelSurfaceDataProxy {
            itemModel: surfaceData.model
            rowRole: "radius"
            columnRole: "angle"
            yPosRole: "value"
        }
    }
2D 効果を有効にするための主なプロパティはorthoProjection とcameraPreset です。グラフの正射投影を有効にして遠近感を取り除き、グラフを真上から見てY次元を取り除く:
// Remove the perspective and view the graph from top down to achieve 2D effect
orthoProjection: true
cameraPreset: Graphs3D.CameraPreset.DirectlyAbove
この視点だと横軸のグリッドがほとんど表面に隠れてしまうので、グラフの上に描かれるように横軸のグリッドを反転させる:
flipHorizontalGrid: true
極スペクトル図
データによっては、デカルトグラフではなく極座標グラフを使う方が自然な場合があります。これはpolar プロパティでサポートされています。
極とデカルトのモードを切り替えるボタンを追加します:
Button {
    id: polarToggle
    anchors.margins: 5
    anchors.left: parent.left
    anchors.top: parent.top
    width: spectrogramView.buttonWidth // Calculated elsewhere based on screen orientation
    text: "Switch to\n" + (surfaceGraph.polar ? "cartesian" : "polar")
    onClicked: surfaceGraph.polar = !surfaceGraph.polar;
}
極座標モードでは、X軸は角度極軸に変換され、Z軸は半径極軸に変換されます。サーフェスポイントは新しい軸に従って再計算されます。
半径軸ラベルはデフォルトではグラフの外側に描画される。グラフ内の0度角軸のすぐ隣に描くには、小さなオフセットだけを定義します:
radialLabelOffset: 0.01
2D効果を強制するには、デフォルトの入力ハンドラをカスタムハンドラでオーバーライドして、正投影モードでのグラフ回転を無効にします。このハンドラは、投影モードに基づいてrotationEnabled プロパティを自動的に切り替えます:
rotationEnabled: !surfaceGraph.orthoProjection
オシロスコープ
Oscilloscope タブで、C++ と QML をアプリケーションで組み合わせ、動的に変化するデータを表示します。
C++のデータソース
アイテムモデルベースのプロキシは、単純なグラフや静的なグラフには適していますが、リアルタイムに変化するデータを表示する場合には、基本的なプロキシを使用して最高のパフォーマンスを実現してください。これらのデータ項目はQObject を継承していないため、QMLのコードから直接操作することができません。この制限を克服するために、単純なDataSource クラスを C++ で実装し、 シリーズのデータプロキシにデータを入力します。
DataSource クラスを作り、QML から呼び出せる二つのメソッドを用意します:
class DataSource : public QObject
{
    Q_OBJECT
    ...
Q_INVOKABLE void generateData(int cacheCount,
                              int rowCount,
                              int columnCount,
                              float xMin,
                              float xMax,
                              float yMin,
                              float yMax,
                              float zMin,
                              float zMax);

Q_INVOKABLE void update(QSurface3DSeries *series);
最初のメソッドgenerateData() は、表示するオシロスコープの模擬データのキャッシュを作成します。データはQSurfaceDataProxy が受け付ける形式でキャッシュされます:
// Populate caches
for (int i = 0; i < cacheCount; i++) {
    QSurfaceDataArray &cache = m_data[i];
    float cacheXAdjustment = cacheStep * i;
    float cacheIndexAdjustment = cacheIndexStep * i;
    for (int j = 0; j < rowCount; j++) {
        QSurfaceDataRow &row = cache[j];
        float rowMod = (float(j)) / float(rowCount);
        float yRangeMod = yRange * rowMod;
        float zRangeMod = zRange * rowMod;
        float z = zRangeMod + zMin;
        qreal waveAngleMul = M_PI * M_PI * rowMod;
        float waveMul = yRangeMod * 0.2f;
        for (int k = 0; k < columnCount; k++) {
            float colMod = (float(k)) / float(columnCount);
            float xRangeMod = xRange * colMod;
            float x = xRangeMod + xMin + cacheXAdjustment;
            float colWave = float(qSin((2.0 * M_PI * colMod) - (1.0 / 2.0 * M_PI)) + 1.0);
            float y = (colWave * ((float(qSin(waveAngleMul * colMod) + 1.0)))) * waveMul
                      + QRandomGenerator::global()->bounded(0.15f) * yRangeMod;

            int index = k + cacheIndexAdjustment;
            if (index >= columnCount) {
                // Wrap over
                index -= columnCount;
                x -= xRange;
            }
            row[index] = QSurfaceDataItem(x, y, z);
        }
    }
}
QSurfaceDataProxy::resetArray2 番目のメソッドupdate() は、キャッシュされたデータの 1 セットを別の配列にコピーします。オーバーヘッドを最小化するために、配列の寸法に変更がない場合は、同じ配列を再利用する:
// Each iteration uses data from a different cached array
m_index++;
if (m_index > m_data.count() - 1)
    m_index = 0;

QSurfaceDataArray array = m_data.at(m_index);
int newRowCount = array.size();
int newColumnCount = array.at(0).size();

// If the first time or the dimensions of the cache array have changed,
// reconstruct the reset array
if (m_resetArray.isEmpty() || series->dataProxy()->rowCount() != newRowCount
    || series->dataProxy()->columnCount() != newColumnCount) {
    m_resetArray.clear();
    m_resetArray.reserve(newRowCount);
    for (int i = 0; i < newRowCount; i++)
        m_resetArray.append(QSurfaceDataRow(newColumnCount));
}

// Copy items from our cache to the reset array
for (int i = 0; i < newRowCount; i++) {
    const QSurfaceDataRow &sourceRow = array.at(i);
    QSurfaceDataRow &row = m_resetArray[i];
    for (int j = 0; j < newColumnCount; j++)
        row[j].setPosition(sourceRow.at(j).position());
}

// Notify the proxy that data has changed
series->dataProxy()->resetArray(m_resetArray);
以前に系列に設定された配列ポインタを操作していても、QSurfaceDataProxy::resetArray ()を呼び出す必要がある。
QMLからDataSource のメソッドにアクセスするためには、DataSourceをQML_ELEMENT にしてデータソースを公開します:
class DataSource : public QObject
{
    Q_OBJECT
    QML_ELEMENT
さらに、CMakeLists.txt で QML モジュールとして宣言してください:
qt6_add_qml_module(surfacegallery
    URI SurfaceGallery
    VERSION 1.0
    NO_RESOURCE_TARGET_PATH
    SOURCES
        datasource.cpp datasource.h
    ...
)すべての環境とビルドでDataSource クラスメソッドのパラメータとしてQSurface3DSeries ポインタを使用するには、メタタイプが登録されていることを確認してください:
qRegisterMetaType<QSurface3DSeries *>();
QML アプリケーション
DataSource を使用するには、QML モジュールをインポートし、使用するDataSource のインスタンスを作成します:
import SurfaceGalleryExample
...
DataSource {
    id: dataSource
}
Surface3D グラフを定義し、Surface3DSeries を与える:
Surface3D {
    id: surfaceGraph
    anchors.fill: parent

    Surface3DSeries {
        id: surfaceSeries
        drawMode: Surface3DSeries.DrawSurfaceAndWireframe
        itemLabelFormat: "@xLabel, @zLabel: @yLabel"
グラフに添付するSurface3DSeries にプロキシを指定しない。これにより、シリーズはデフォルトのQSurfaceDataProxy を利用することになります。
項目ラベルをitemLabelVisible で隠す。動的で変化の速いデータでは、選択ラベルが浮いていると邪魔になり、読みにくくなります。
itemLabelVisible: false
選択ポインタの上にあるデフォルトのフローティング・ラベルの代わりに、Text 要素に選択項目情報を表示することができます:
onItemLabelChanged: {
    if (surfaceSeries.selectedPoint == surfaceSeries.invalidSelectionPosition)
        selectionText.text = "No selection";
    else
        selectionText.text = surfaceSeries.itemLabel;
}
グラフが完成したら、generateData() のヘルパー関数を呼び出してDataSource キャッシュを初期化し、DataSource の同名のメソッドを呼び出します:
Component.onCompleted: oscilloscopeView.generateData();
...
function generateData() {
    dataSource.generateData(oscilloscopeView.sampleCache, oscilloscopeView.sampleRows,
                            oscilloscopeView.sampleColumns,
                            surfaceGraph.axisX.min, surfaceGraph.axisX.max,
                            surfaceGraph.axisY.min, surfaceGraph.axisY.max,
                            surfaceGraph.axisZ.min, surfaceGraph.axisZ.max);
}
データの更新をトリガーするには、DataSource のupdate() メソッドを要求された間隔で呼び出すTimer を定義する:
Timer {
    id: refreshTimer
    interval: 1000 / frequencySlider.value
    running: true
    repeat: true
    onTriggered: dataSource.update(surfaceSeries);
}
ダイレクト・レンダリングの有効化
このアプリケーションは、急速に変化する多くのデータを扱う可能性があるため、パフォーマンスのためにダイレクト・レンダリング・モードを使用します。このモードでアンチエイリアスを有効にするには、アプリケーションウィンドウのサーフェスフォーマットを変更します。QQuickView で使用されるデフォルトのフォーマットは、アンチエイリアスをサポートしていません。main.cpp のサーフェスフォーマットを変更するには、提供されているユーティリティ関数を使用してください:
#include <QtGraphs/qutils.h>
...
// Enable antialiasing in direct rendering mode
viewer.setFormat(QQuick3D::idealSurfaceFormat(8));
コンテンツ例
© 2026 The Qt Company Ltd. Documentation contributions included herein are the copyrights of their respective owners. The documentation provided herein is licensed under the terms of the GNU Free Documentation License version 1.3 as published by the Free Software Foundation. Qt and respective logos are trademarks of The Qt Company Ltd. in Finland and/or other countries worldwide. All other trademarks are property of their respective owners.
