Debug
The Debug view is shown in the Test Debugging Perspective.
It shows the filename and line number where Squish has stopped—for example, at a breakpoint—including a full backtrace.
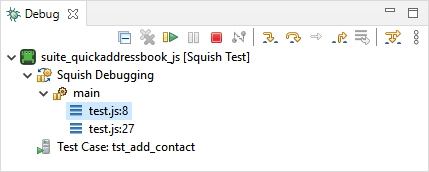
The Debug view
To jump anywhere in the backtrace, click the relevant item in the tree.
The following table summarizes the actions of the toolbar buttons in the Debug view:
| Icon | Toolbar Button Name | Action |
|---|---|---|
 | Remove Terminated Launches | Clears the details of any AUTs that have been terminated from the view. |
 | Resume | Resumes the execution of a test case that has stopped at a breakpoint. |
 | Suspend | This action is not needed or functional in the Squish IDE. |
 | Terminate | Terminates the execution of a test case that has stopped at a breakpoint. |
 | Disconnect | This action is not functional in the Squish IDE. |
 | Step Into | Continues the execution of a test case that has been stopped. |
 | Step Over | Continues the execution of a test case that has been stopped. |
 | Step Return | Continues the execution of a test case that has been stopped. |
 | Drop To Frame | This action is not functional in the Squish IDE. |
 | Use Step Filters | This toggle action is not functional in the Squish IDE. |
 | View Menu | Provides menu options for controlling how the view presents its data. |
© 2025 The Qt Company Ltd.
Documentation contributions included herein are the copyrights of
their respective owners.
The documentation provided herein is licensed under the terms of the GNU Free Documentation License version 1.3 as published by the Free Software Foundation.
Qt and respective logos are trademarks of The Qt Company Ltd. in Finland and/or other countries worldwide. All other trademarks are property
of their respective owners.
