コックピット
グラフを使って飛行機のコックピットを模したアプリケーションの例。
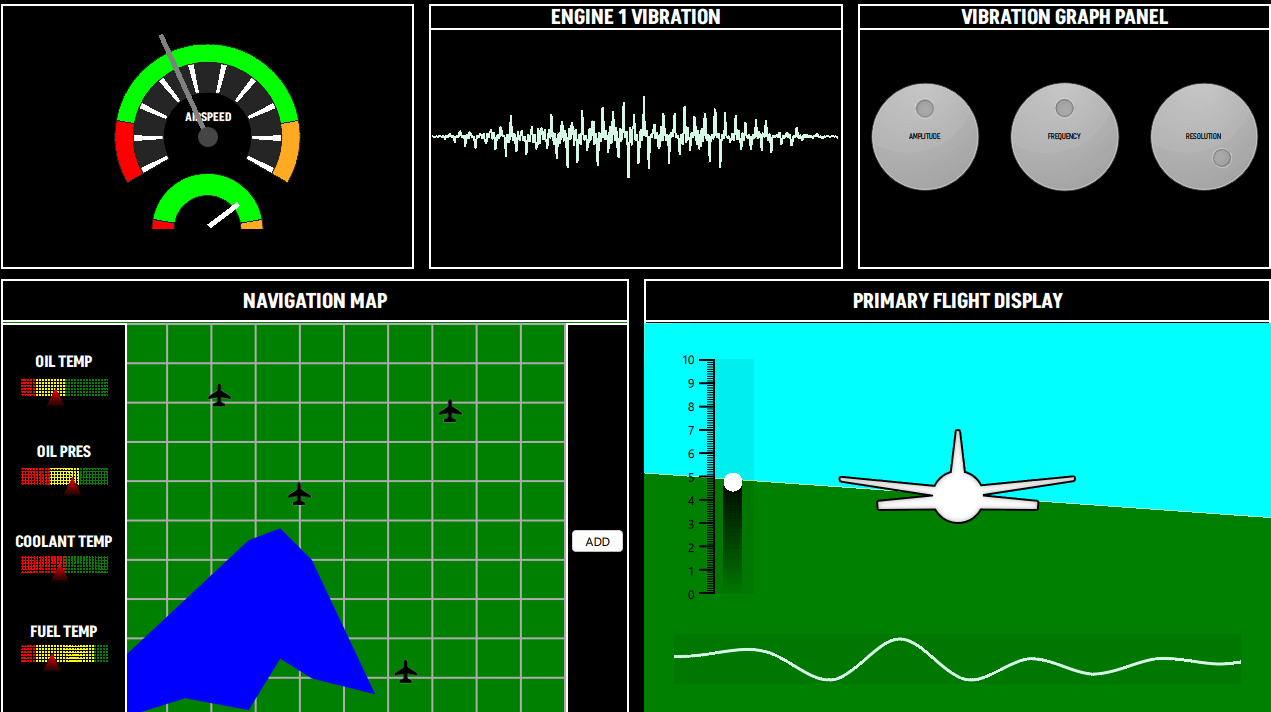
コックピットの例では、架空の飛行機のコントロール画面を描くために、さまざまな種類のグラフが用意されています。サンプルで使用されているグラフは以下の通りです:
- PieSeries (スピードメーター)
- LineSeries (振動パネル、ナビゲーションマップ)
- AreaSeries (ナビゲーションマップ、プライマリフライトディスプレイ)
- BarSeries (航法マップ、プライマリーフライトディスプレイ)
- ScatterSeries (ナビゲーションマップ)
- SplineSeries (プライマリ・フライト・ディスプレイ)
例の実行
から例を実行するには Qt Creatorからサンプルを実行するには、Welcome モードを開き、Examples からサンプルを選択します。詳細については、Qt Creator:Tutorialを参照してください:ビルドと実行。
スピードメーター
スピードメータービューは3つのPieSeries 、1つのGraphsView 、2つの文字盤の針としてQMLレクタングルを使用しています。
GraphsTheme のbackgroundVisibleプロパティはfalse に設定されています。すべてのPieSlices はそれぞれ独自のカスタムカラーを持っています。中心が空洞になっている円形の目盛りを表示するために、この例では異なるholeSize を持つPieSeries を使用しています。
GraphsView {
    id: chart
    anchors.fill: parent
    anchors.margins: 20

    theme: GraphsTheme {
        backgroundVisible: false
        borderColors: ["#252525"]
    }

    PieSeries {
        id: pieOuter
        pieSize: 1
        holeSize: 0.8
        startAngle: -120
        endAngle: 120

        PieSlice { label: "Stall"; value: 1; color: "#ff0000"; labelVisible: false }
        PieSlice { label: "Optimal"; value: 4; color: "#00ff00"; labelVisible: false }
        PieSlice { label: "Overspeed"; value: 1; color: "#ffaa22"; labelVisible: false }
    }

    PieSeries {
        pieSize: 0.8
        holeSize: 0.6
        startAngle: -120
        endAngle: 120

        PieSlice { value: 1; color: "#ffffff"; }
        PieSlice { value: 4; color: "#252525"; }
        PieSlice { value: 1; color: "#ffffff"; }
        PieSlice { value: 4; color: "#252525"; }
        PieSlice { value: 1; color: "#ffffff"; }
        PieSlice { value: 4; color: "#252525"; }
        PieSlice { value: 1; color: "#ffffff"; }
        PieSlice { value: 4; color: "#252525"; }
        PieSlice { value: 1; color: "#ffffff"; }
        PieSlice { value: 4; color: "#252525"; }
        PieSlice { value: 1; color: "#ffffff"; }
        PieSlice { value: 4; color: "#252525"; }
        PieSlice { value: 1; color: "#ffffff"; }
        PieSlice { value: 4; color: "#252525"; }
        PieSlice { value: 1; color: "#ffffff"; }
        PieSlice { value: 4; color: "#252525"; }
        PieSlice { value: 1; color: "#ffffff"; }
        PieSlice { value: 4; color: "#252525"; }
        PieSlice { value: 1; color: "#ffffff"; }
    }

    PieSeries {
        pieSize: 0.6
        holeSize: 1.0
        startAngle: -120
        endAngle: 120
        verticalPosition: 1

        PieSlice { label: "Stall"; value: 1; color: "#ff0000"; labelVisible: false }
        PieSlice { label: "Optimal"; value: 4; color: "#00ff00"; labelVisible: false  }
        PieSlice { label: "Overspeed"; value: 1; color: "#ffaa22"; labelVisible: false  }
    }
}
振動パネル
Vibration Panel にはLineSeries があり、実行時に動的に更新されます。起動後、QML のappend関数を使用して一連のポイントが追加されます。その後、各フレームで、replace関数を使用して値が計算値で置き換えられます。これらの値は振動グラフパネルで変更することができます。
LineSeries {
    id: line
    property int divisions: 500
    property real amplitude: 0.5
    property real resolution: 0.5

    FrameAnimation {
        running: true

        onTriggered: {
            for (let i = 0; i < line.divisions; ++i) {
                let y = Math.sin(line.resolution*i)
                y *= Math.cos(i)
                y *= Math.sin(i / line.divisions * 3.2) * 3 * line.amplitude * Math.random()

               line.replace(i, (i/line.divisions) * 8.0, y + 4)
            }
        }
    }

    Component.onCompleted: {
        for (let i = 1; i <= divisions; ++i) {
            append((i/divisions) * 8.0, 4.0)
        }
    }

    function change(newDivs) {
        let delta = newDivs - divisions

        if (delta < 0) {
            delta = Math.abs(delta)
            removeMultiple(count - 1 - delta, delta)
        } else {
            for (let i = 0; i < delta; ++i) {
                append(((count + i)/divisions) * 8.0, 4.0)
            }
        }

        divisions = newDivs
    }
}
振動グラフパネル
このパネルには、振動パネルに表示される視覚化に影響する値を調整するためのコントロールノブがあります。
ナビゲーションマップ
ナビゲーションマップには 2 つの主要セクションがあります:
- BarSeries BarSets
BarSeries {
    property real barOpacity: 0.

    id: barSeries
    barsType: BarSeries.BarsType.Stacked
    barWidth: 0.2

    barDelegate: Item {
        id: delegate
        antialiasing: true
        property real barOpacity: 0.5
        property color barColor
        property string barLabel

        FrameAnimation {
            running: true
            onTriggered: {
                delegate.barOpacity = Math.abs(Math.sin(elapsedTime))
            }
        }
        ShaderEffect {
            id: effect
            readonly property alias iTime: delegate.barOpacity
            readonly property alias iColor: delegate.barColor
            readonly property vector3d iResolution: Qt.vector3d(width, height, 1.0)

            blending: true
            fragmentShader: 'bar.frag.qsb'
            anchors.fill: parent
        }
    }

    BarSet { id: set1; label: "Low"; values: [1, 2, 3, 1]; color: "red" }
    BarSet { id: set2; label: "Medium"; values: [2, 2, 0, 4]; color: "yellow"}
    BarSet { id: set3; label: "High"; values: [3, 2, 3, 1]; color: "green"}
}
- 右側のパネルには以下のものがあります:
- AreaSeries 、2つのLineSeries 、架空の湖を視覚化している。
- その上のScatterSeries は、地図上に空港などのカスタムアイコンを表示します。
- ADDボタンは、パスを作成するためにポイントを移動できるLineSeries を追加します。このLineSeries 、pointDelegateにカスタムシェーダーを使用し、ScatterSeries 、画像を使用しています。
AreaSeries {
    property double x: 0
    property double y: 0

    id: lake1
    color: "blue"
    upperSeries: LineSeries {
        id: s1
        XYPoint { x: 0.0; y: -3.5 }
        XYPoint { x: 1.0; y: -5.0 }
        XYPoint { x: 2.0; y: -2.5 }
        XYPoint { x: 2.5; y: -4.0 }
        XYPoint { x: 3.0; y: -4.2 }
    }

    lowerSeries: LineSeries {
        id: s2
        XYPoint { x: 0.0; y: -7.2 }
        XYPoint { x: 1.0; y: -7.0 }
        XYPoint { x: 2.0; y: -8.5 }
        XYPoint { x: 2.5; y: -8.0 }
        XYPoint { x: 3.0; y: -9.0 }
        XYPoint { x: 4.0; y: -6.5 }
    }
}

AreaSeries {
    property double x: 0
    property double y: 0

    id: lake2
    color: "blue"
    upperSeries: LineSeries {
        id: s3
        XYPoint { x: 0.0; y: 1.5 }
        XYPoint { x: 1.0; y: 3.0 }
        XYPoint { x: 2.0; y: 4.5 }
        XYPoint { x: 2.5; y: 4.8 }
        XYPoint { x: 3.0; y: 4.0 }
    }

    lowerSeries: LineSeries {
        id: s4
        XYPoint { x: 0.0; y: 0.0 }
        XYPoint { x: 1.0; y: 0.5 }
        XYPoint { x: 2.0; y: 0.2 }
        XYPoint { x: 2.5; y: 1.5 }
        XYPoint { x: 3.0; y: 1.0 }
        XYPoint { x: 4.0; y: 0.6 }
    }
}

// POI
ScatterSeries {
    name: "Airport"

    pointDelegate: Image {
            source: "airplane-ico.png"
            mipmap: true
            width: 30
            height: 30
    }

    XYPoint{x: 4.0; y: 5.7}
    XYPoint{x: 2.2; y: 8.2}
    XYPoint{x: 6.4; y: 1.2}
    XYPoint{x: 7.4; y: 7.8}
}

LineSeries {
    id: linePath
    selectable: true
    draggable: true
    color: "white"
    pointDelegate: Item {
        width: 50
        height: 50
        property real pointValueX
        property real pointValueY

        FrameAnimation {
            id: scatterAnim
            running: true
        }

        ShaderEffect {
            readonly property vector3d iResolution: Qt.vector3d(width, height, 1.0)
            readonly property alias iTime: scatterAnim.elapsedTime

            blending: true
            fragmentShader: 'circleMarker.frag.qsb'
            anchors.fill: parent
        }

        Text {
            color: "white"
            font.pointSize: 4
            text: "LAT: " + pointValueX.toFixed(1) + ", " + "LON: " + pointValueY.toFixed(1)
        }
    }
}
プライマリーフライトディスプレイ
プライマリ・フライト・ディスプレイは、地形の "3D "ビューを模倣しています。地上と空をそれぞれカスタムカラーで表現するために、2つのAreaSeries 。FrameAnimation はこれらのシリーズの値を更新します。
AreaSeries {
    id: upperArea
    color: "cyan"

    upperSeries: LineSeries {
        XYPoint {x: 0; y: 10}
        XYPoint {x: 10; y: 10}
    }

    lowerSeries: LineSeries {
        id: upperLine
        XYPoint {x: 0; y: 3}
        XYPoint {x: 10; y: 4}
    }
}

FrameAnimation {
    running: true
    onTriggered: {
        upperLine.replace(0, upperLine.at(0).x, Math.sin(elapsedTime) + 6)
        upperLine.replace(1, upperLine.at(1).x, Math.cos(elapsedTime) + 6)
        lowerLine.replace(0, lowerLine.at(0).x, Math.sin(elapsedTime) + 6)
        lowerLine.replace(1, lowerLine.at(1).x, Math.cos(elapsedTime) + 6)
        barSet.values = [Math.sin(elapsedTime) + 5]
    }
}
左側では、テーマ別のBarSeries がY軸のラベルを表示する。このBarSeries 、バーにもカスタムシェーダーを使用しています。
BarSeries {
    id: barSeries
    selectable: true
    barDelegate: Item {
        id: delegate
        antialiasing: true
        property real barOpacity: 0.5
        property color barColor
        property string barLabel

        ShaderEffect {
            id: effect
            readonly property vector3d iResolution: Qt.vector3d(width, height, 1.0)

            blending: true
            fragmentShader: 'pitchbar.frag.qsb'
            anchors.fill: parent
        }
    }

    BarSet { id: barSet; values: []; selectedColor: "red" }
}
ビューの下部には、SplineSeries 、飛行機下の地形の高さを視覚化しています。SplineSeries はフレームごとに更新されます。シリーズを更新するコードは、連続したポイントのシリーズを後ろに追加し、前から削除します。ホバーすると、SplineSeries 、Y軸の値(高度)を表示するツールチップが表示されます。
GraphsView {
    anchors.fill: parent
    anchors.leftMargin: -90
    anchors.rightMargin: -80
    anchors.bottomMargin: -30

    theme: GraphsTheme {
        backgroundVisible: false
        plotAreaBackgroundColor: "#11000000"
    }

    axisX: ValueAxis {
        max: 10
        subTickCount: 9
        lineVisible: false
        gridVisible: false
        subGridVisible: false
        labelsVisible: false
        visible: false
    }

    axisY: ValueAxis {
        max: 10
        subTickCount: 9
        lineVisible: false
        gridVisible: false
        subGridVisible: false
        labelsVisible: false
        visible: false
    }

    ToolTip {
        id: tooltip
    }

    onHoverEnter: {
        tooltip.visible = true;
    }

    onHoverExit: {
        tooltip.visible = false;
    }

    onHover: (seriesName, position, value) => {
                 tooltip.x = position.x + 1;
                 tooltip.y = position.y + 1;
                 tooltip.text = "Altitude: " + (value.y * 1000).toFixed(1) + "m";
             }

    FrameAnimation {
        property var points: []

        Component.onCompleted: {
            for (let i = 0; i < altitudeLine.count; ++i) {
                points[i] = altitudeLine.at(i)
            }
        }

        running: true
        onTriggered: {
            for (let i = 0; i < points.length; ++i) {
                points[i].x -= frameTime

                if (points[1].x <= -2) {
                    let p = points[0]
                    p.x = points[points.length - 1].x + 1
                    altitudeLine.append(p)
                    altitudeLine.remove(0)

                    points.length = 0

                    for (let i = 0; i < altitudeLine.count; ++i) {
                        points[i] = altitudeLine.at(i)
                    }
                }
            }
            altitudeLine.replace(points)
            altitudeLine.update()
        }
    }

    SplineSeries {
        id: altitudeLine
        hoverable: true
        width: 3

        XYPoint {x: 0; y: 5}
        XYPoint {x: 1; y: 2}
        XYPoint {x: 2; y: 5}
        XYPoint {x: 3; y: 4}
        XYPoint {x: 4; y: 6}
        XYPoint {x: 5; y: 7}
        XYPoint {x: 6; y: 9}
        XYPoint {x: 7; y: 8}
        XYPoint {x: 8; y: 9}
        XYPoint {x: 9; y: 6}
        XYPoint {x: 10; y: 6}
        XYPoint {x: 11; y: 6}
        XYPoint {x: 12; y: 1}
        XYPoint {x: 13; y: 9}
        XYPoint {x: 14; y: 1}
    }

}
© 2026 The Qt Company Ltd. Documentation contributions included herein are the copyrights of their respective owners. The documentation provided herein is licensed under the terms of the GNU Free Documentation License version 1.3 as published by the Free Software Foundation. Qt and respective logos are trademarks of The Qt Company Ltd. in Finland and/or other countries worldwide. All other trademarks are property of their respective owners.
