Debugging Qt Quick projects
For an example of how to debug Qt Quick Projects, see Tutorial: Qt Quick debugging.
Note: In this section, you are using advanced menu items. These are not visible by default. To toggle the visibility of advanced menu items, see Customizing the Menu Bar.
Setting up QML debugging
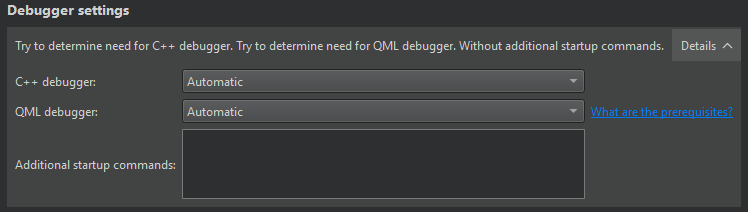
To debug Qt Quick UI projects (.qmlproject), select Automatic or Enabled in Run Settings > Debugger Settings > QML debugger.
Starting QML debugging
To start the application, choose Debug > Start Debugging > Start Debugging of Startup Project or select F5. Once the application starts running, it behaves and performs as usual. You can then perform the following tasks:
- Debug JavaScript functions
- Execute JavaScript expressions to get information about the state of the application
- Inspect QML properties and JavaScript variables and change them temporarily at runtime
To debug already running applications:
- Start the application with the following arguments:
-qmljsdebugger=port:<port>[,host:<ip address>][,block]Where
port(mandatory) specifies the debugging port,ip address(optional) specifies the IP address of the host where the application is running, andblock(optional) prevents the application from running until the debug client connects to the server. This enables debugging from the start.Note: Setting breakpoints is only possible if the application is started with block mode.
- Go to Debug > Start Debugging > Attach to QML Port.
Choose the kit configured for the device where the application to be debugged is running. The port number to use is displayed in the standard output when the application starts.
Debugging JavaScript functions
You can use the Qt Design Studio Debug mode to inspect the state of your application while debugging. You can interact with the debugger by:
- Viewing call stack trace
- Setting breakpoints
- Viewing local variables and function parameters
- Evaluating expressions
Inspecting items
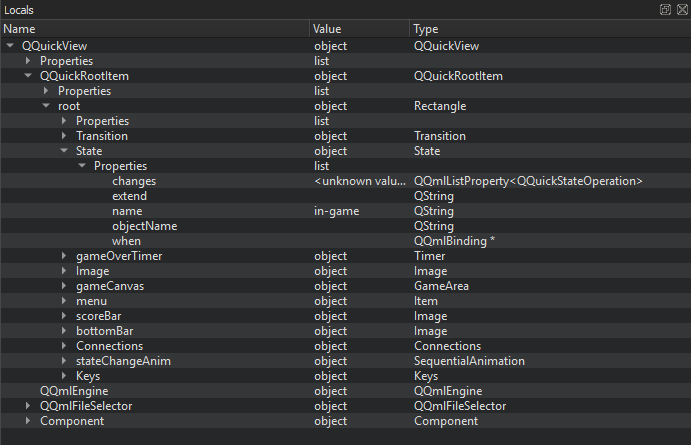
While the application is running, you can use the Locals view to explore the QML item structure.
To keep the application visible while you interact with the debugger, select Debug > Show Application on Top.
You can view a QML item in the Locals view in the following ways:
- Expand the item in the object tree.
- Select the item in the code editor.
- Go to Debug > Select to activate selection mode and then select an item in the running application.
To change property values temporarily, without editing the source, double-click them and enter the new values. You can view the results in the running application.
Inspecting user interfaces
When you debug complex applications, you can jump to the position in code where an item is defined.
In the selection mode, you can select items in the running application to jump to their definitions in the code. The properties of the selected item are displayed in the Locals view.
You can also view the item hierarchy in the running application:
Double-click an item in the running application to cycle through the item stack at the cursor position.
To switch out of the selection mode, toggle the Select menu item.
To move the application running in Qt QML Viewer to the front, select Debug > Show Application on Top.
Executing JavaScript expressions
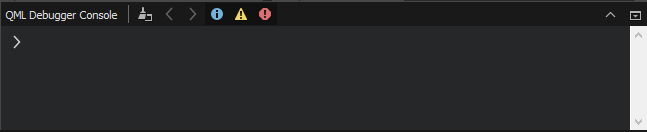
When the application is interrupted by a breakpoint, you can use the QML Debugger Console to execute JavaScript expressions in the current context. To open it, choose View > Output > QML Debugger Console.
You can change property values temporarily, without editing the source, and view the results in the running application. You can change the property values permanently in the Properties view.
Applying QML changes at runtime
When you change property values in the QML Debugger Console or in the Locals or Expression view, they are immediately updated in the running application, but not in the source code.
Available under certain Qt licenses.
Find out more.
