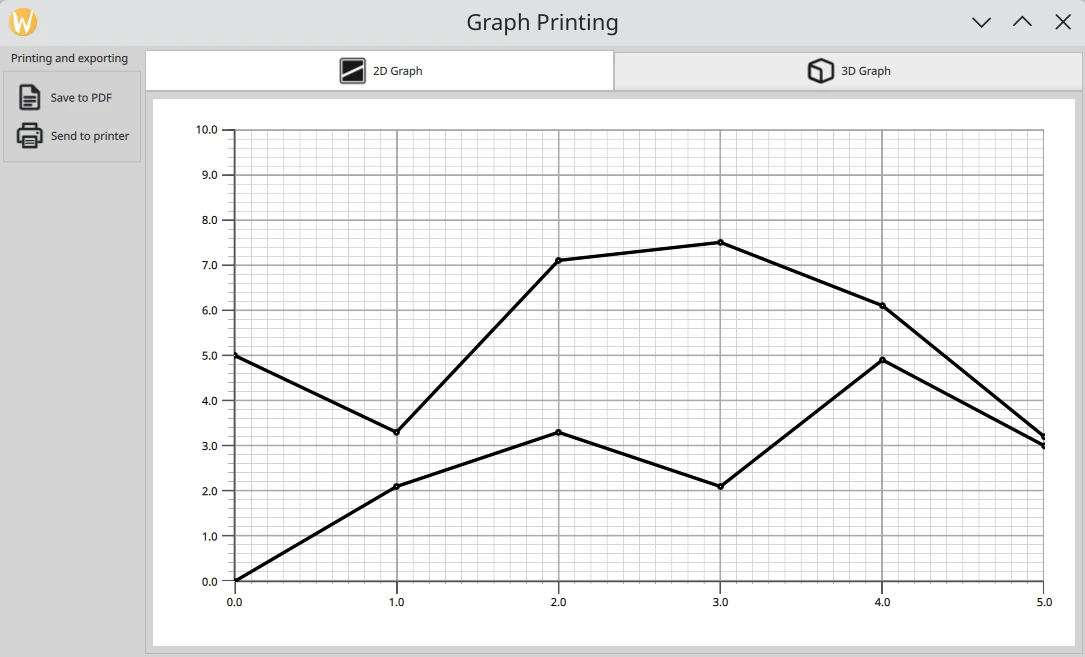
Graph Printing Example
The Graph Printing example demonstrates how to print or export to PDF 2D and 3D graphs.
The printing functionality is implemented in the GraphPrinter class whose
slots are invoked from QML, passing an image obtained from
QuickItem.grabToImage() . The image is scaled and painted onto either
a QPrinter or a
QPdfWriter, which inherit
QPaintDevice.
# Copyright (C) 2026 The Qt Company Ltd.
# SPDX-License-Identifier: LicenseRef-Qt-Commercial OR BSD-3-Clause

import sys
from pathlib import Path

from PySide6.QtCore import QCoreApplication, QSize, Qt
from PySide6.QtGui import QGuiApplication, QShortcut, QKeySequence
from PySide6.QtQuick import QQuickView

from graphprinter import GraphPrinter


if __name__ == "__main__":
    app = QGuiApplication(sys.argv)

    viewer = QQuickView()
    viewer.setTitle("Graph Printing")
    graphPrinter = GraphPrinter()
    viewer.rootContext().setContextProperty("graphPrinter", graphPrinter)
    viewer.setMinimumSize(QSize(1280, 720))
    viewer.engine().addImportPath(Path(__file__).parent)
    viewer.loadFromModule("GraphPrintingExample", "Main")
    window = viewer.rootObject()
    if not window:
        sys.exit(-1)
    quitKey = QKeySequence(QKeySequence.StandardKey.Quit)
    if not quitKey.isEmpty():
        quitShortcut = QShortcut(quitKey, window)
        quitShortcut.activated.connect(app.quit)
        quitShortcut.setContext(Qt.ShortcutContext.ApplicationShortcut)
    viewer.setResizeMode(QQuickView.ResizeMode.SizeRootObjectToView)
    viewer.setColor(Qt.GlobalColor.white)
    viewer.show()

    ex = QCoreApplication.exec()
    del viewer
    sys.exit(ex)
# Copyright (C) 2026 The Qt Company Ltd.
# SPDX-License-Identifier: LicenseRef-Qt-Commercial OR BSD-3-Clause

from PySide6.QtCore import QObject, QMarginsF, QUrl, Qt, Property, Slot
from PySide6.QtGui import (QDesktopServices, QImage, QPageSize, QPainter, QPaintDevice,
                           QPdfWriter)
from PySide6.QtQml import QmlElement
from PySide6.QtPrintSupport import QPrinter, QPrinterInfo

QML_IMPORT_NAME = "GraphPrintingExample"
QML_IMPORT_MAJOR_VERSION = 1


@QmlElement
class GraphPrinter(QObject):

    def __init__(self, parent=None):
        super().__init__(parent)

    @Property(int, constant=True)
    def maxTextureSize(self):
        return 4096  # Use 4096 as the minimum

    def paintImage(self, image: QImage, device: QPaintDevice):
        painter = QPainter(device)
        viewportSize = painter.viewport().size()
        imageSize = image.size()
        print(f"Scaling {imageSize.width()}x{imageSize.height()} to "
              f"{viewportSize.width()}x{viewportSize.height()}.")
        finalImage = image.scaled(viewportSize, Qt.AspectRatioMode.KeepAspectRatio)
        painter.setRenderHint(QPainter.RenderHint.LosslessImageRendering)
        painter.drawImage(finalImage.rect(), finalImage)
        painter.end()

    def _generatePDF(self, fileName: str, image: QImage):
        writer = QPdfWriter(fileName)
        writer.setResolution(90)
        writer.setTitle("Graph")
        writer.setPageSize(QPageSize(image.size()))
        writer.setPageMargins(QMarginsF(0, 0, 0, 0))
        writer.newPage()
        self.paintImage(image, writer)

    @Slot(QUrl, QImage, result=str)
    def generatePDF(self, path: QUrl, image: QImage):
        fileName = path.toLocalFile()
        self._generatePDF(fileName, image)

        QDesktopServices.openUrl(path)

        return fileName

    @Slot(QImage, str, result=str)
    def print(self, image: QImage, printerName: str):
        printInfo = QPrinterInfo.printerInfo(printerName)
        if printInfo.isNull():
            return f"{printerName} is not a valid printer"

        printer = QPrinter(printInfo, QPrinter.PrinterMode.HighResolution)
        printer.setOutputFormat(QPrinter.OutputFormat.NativeFormat)
        self.paintImage(image, printer)

        return f"Printed to {printerName}"

    @Slot(result="QStringList")
    def getPrinters(self):
        return QPrinterInfo.availablePrinterNames()
module GraphPrintingExample
Main 1.0 Main.qml
Graph2D 1.0 Graph2D.qml
Graph3D 1.0 Graph3D.qml
// Copyright (C) 2026 The Qt Company Ltd.
// SPDX-License-Identifier: LicenseRef-Qt-Commercial OR BSD-3-Clause

import QtCore
import QtQuick
import QtQuick.Layouts
import QtQuick.Controls.Fusion
import QtQuick.Dialogs

Rectangle {
    id: mainView
    width: 1280
    height: 720
    color: Application.styleHints.colorScheme === Qt.Dark ? "darkgray" : "lightgray"

    property var item: stackLayout.itemAt(stackLayout.currentIndex)
    property var outputsize: Qt.size(linegraph.width * 4, linegraph.height * 4)

    RowLayout {
        id: rowLayout
        anchors.fill: parent
        anchors.leftMargin: 5
        anchors.rightMargin: 5
        anchors.topMargin: 5
        anchors.bottomMargin: 5
        spacing: 5

        GroupBox {
            id: groupBox
            Layout.alignment: Qt.AlignLeft | Qt.AlignTop
            title: qsTr("Printing and exporting")

            ColumnLayout {
                id: buttonLayout
                spacing: 0
                uniformCellSizes: true
                Button {
                    id: captureButton
                    text: qsTr("Save to PDF")
                    flat: true

                    icon.source: pressed ? "documents_fill.svg" : "documents.svg"
                    icon.height: 36
                    icon.width: 36

                    onPressed: dialog.open()
                }

                Button {
                    id: printButton
                    text: qsTr("Send to printer")
                    flat: true

                    icon.source: pressed ? "print_fill.svg" : "print.svg"
                    icon.height: 36
                    icon.width: 36

                    onPressed: printerDialog.open()
                }
            }
        }

        Item {
            id: tabGroup
            Layout.fillHeight: true
            Layout.fillWidth: true

            TabBar {
                id: tabBar
                anchors.left: parent.left
                anchors.right: parent.right

                TabButton {
                    text: "2D Graph"
                    implicitHeight: 48
                    icon.source: checked ? "flatten_square_fill.svg" : "flatten.svg"
                    icon.height: 36
                    icon.width: 36
                }

                TabButton {
                    text: "3D Graph"
                    implicitHeight: 48
                    icon.source: checked ? "box_left_fill.svg" : "box_left.svg"
                    icon.height: 36
                    icon.width: 36
                }
            }
            Frame {
                id: tabFrame
                anchors.left: parent.left
                anchors.right: parent.right
                anchors.top: tabBar.bottom
                anchors.bottom: parent.bottom

                StackLayout {
                    id: stackLayout

                    anchors.fill: parent
                    currentIndex: tabBar.currentIndex

                    Graph2D {
                        id: linegraph
                    }

                    Graph3D {
                        id: bargraph
                    }
                }
            }
        }
    }

    MessageDialog {
        id: message
        onButtonClicked: mainView.cleanAfterPrint()
    }

    FileDialog {
        id: dialog
        currentFolder: StandardPaths.writableLocation(StandardPaths.PicturesLocation)
        nameFilters: ["PDF files (*.pdf)"]
        defaultSuffix: "pdf"

        fileMode: FileDialog.SaveFile
        onAccepted: {
            mainView.prepareForPrint()

            mainView.item.grabToImage(function (result) {
                message.title = "Save PDF"
                message.text = "PDF saved to " + graphPrinter.generatePDF(
                            dialog.selectedFile, result.image)
                message.open()
            }, mainView.outputsize)
        }
    }

    Dialog {
        id: printerDialog
        anchors.centerIn: parent
        contentHeight: printerListView.height
        contentWidth: printerListView.width

        title: qsTr("Available Printers")
        modal: true

        onOpened: {
            printerModel.clear()
            var printers = graphPrinter.getPrinters()
            printers.forEach((x, i) => printerModel.append({
                                                               "name": x
                                                           }))
        }

        onAccepted: {
            var selectedPrinter = printerModel.get(printerListView.currentIndex)
            mainView.prepareForPrint()
            mainView.item.grabToImage(function (result) {
                message.title = "Print"
                message.text = graphPrinter.print(result.image,
                                                  selectedPrinter.name)
                message.open()
            }, mainView.outputsize)
        }

        onClosed: {
            mainView.cleanAfterPrint()
        }

        Component {
            id: printerDelegate
            Rectangle {
                width: 198
                height: 25
                color: "transparent"
                border.color: mainView.item.theme.grid.mainColor
                clip: true

                Text {
                    padding: 5
                    text: qsTr("<b>%1</b>").arg(name)
                    color: mainView.item.theme.labelTextColor
                }

                MouseArea {
                    anchors.fill: parent
                    onClicked: printerListView.currentIndex = index
                }
            }
        }

        contentItem: Rectangle {
            id: printerItem
            height: printerListView.height
            width: printerListView.width
            color: mainView.item.theme.plotAreaBackgroundColor

            ListView {
                id: printerListView
                height: 100
                width: 200
                clip: true

                model: printerModel
                delegate: printerDelegate
                highlight: Rectangle {
                    color: mainView.item.theme.grid.subColor
                }
            }
        }

        footer: DialogButtonBox {
            Button {
                text: "Print"
                DialogButtonBox.buttonRole: DialogButtonBox.AcceptRole
            }
            Button {
                text: "Cancel"
                DialogButtonBox.buttonRole: DialogButtonBox.RejectRole
            }
        }
    }

    ListModel {
        id: printerModel
    }

    function prepareForPrint() {
        if (stackLayout.currentIndex === 1) {
            var newsize = Qt.size(bargraph.width * 4, bargraph.height * 4)

            // check that we do not exceed maximum texture size
            if (newsize.width * Screen.devicePixelRatio > graphPrinter.maxTextureSize ) {
                // scale to 25% under max texture size to be on the safe side; some GPUs seem
                // to glitch when using the abosulute max
                var ratio = (newsize.width * Screen.devicePixelRatio * 1.25)
                        / graphPrinter.maxTextureSize
                newsize.width /= ratio
                newsize.height /= ratio
            }
            outputsize.width = Math.round(newsize.width)
            outputsize.height = Math.round(newsize.height)

            // resize the bar graph to match the PDF output size
            item.width = outputsize.width
            item.height = outputsize.height
        } else {
            outputsize = Qt.size(linegraph.width * 4, linegraph.height * 4)
        }
    }

    function cleanAfterPrint() {
        if (stackLayout.currentIndex === 1) {
            // resize the bar graph back to the actual visual size
            item.width = stackLayout.width
            item.height = stackLayout.height
        }
    }
}
// Copyright (C) 2026 The Qt Company Ltd.
// SPDX-License-Identifier: LicenseRef-Qt-Commercial OR BSD-3-Clause

import QtQuick
import QtGraphs

Rectangle {
    id: graphContainer
    width: 1280
    height: 720
    property alias theme: lines.theme

    color: "white"

    GraphsView {
        id: lines
        anchors.fill: parent
        anchors.margins: 16
        theme: GraphsTheme {
            grid.mainColor: "darkgrey"
            grid.subColor: "lightgrey"
            labelTextColor: "black"
            plotAreaBackgroundColor: "white"
            backgroundColor: "white"
            colorScheme: Qt.Light
        }
        axisX: ValueAxis {
            max: 5
            tickInterval: 1
            subTickCount: 9
            labelDecimals: 1
        }
        axisY: ValueAxis {
            max: 10
            tickInterval: 1
            subTickCount: 4
            labelDecimals: 1
        }

        component Marker : Rectangle {
            width: 8
            height: 8
            color: "#ffffff"
            radius: width * 0.5
            border.width: 4
            border.color: "#000000"
        }

        LineSeries {
            id: lineSeries1
            width: 4
            pointDelegate: Marker { }
            color: "black"
            XYPoint { x: 0; y: 0 }
            XYPoint { x: 1; y: 2.1 }
            XYPoint { x: 2; y: 3.3 }
            XYPoint { x: 3; y: 2.1 }
            XYPoint { x: 4; y: 4.9 }
            XYPoint { x: 5; y: 3.0 }
        }

        LineSeries {
            id: lineSeries2
            width: 4
            pointDelegate: Marker { }
            color: "black"
            XYPoint { x: 0; y: 5.0 }
            XYPoint { x: 1; y: 3.3 }
            XYPoint { x: 2; y: 7.1 }
            XYPoint { x: 3; y: 7.5 }
            XYPoint { x: 4; y: 6.1 }
            XYPoint { x: 5; y: 3.2 }
        }
    }
}
// Copyright (C) 2026 The Qt Company Ltd.
// SPDX-License-Identifier: LicenseRef-Qt-Commercial OR BSD-3-Clause

import QtQuick
import QtGraphs

Item {
    id: graphContainer
    width: 1280
    height: 720
    property alias theme: bars.theme

    Bars3D {
        id: bars
        anchors.fill: parent
        msaaSamples: 8
        cameraPreset: Graphs3D.CameraPreset.IsometricLeftHigh

        theme: GraphsTheme {
            backgroundColor: "white"
            plotAreaBackgroundVisible: false
            grid.mainColor: "black"
            labelFont.pointSize: 20
            labelBackgroundVisible: false
            colorScheme: Qt.Light
        }

        Bar3DSeries {
            id: series
            itemLabelFormat: "Expenses, @colLabel, @rowLabel: -@valueLabel"
            baseGradient: gradient
            colorStyle: GraphsTheme.ColorStyle.RangeGradient

            ItemModelBarDataProxy {
                id: barProxy
                itemModel: ListModel {
                    ListElement{ coords: "0,0"; data: "4.75"; }
                    ListElement{ coords: "1,0"; data: "3.00"; }
                    ListElement{ coords: "0,1"; data: "3.55"; }
                    ListElement{ coords: "1,1"; data: "3.03"; }
                    ListElement{ coords: "0,2"; data: "3.37"; }
                    ListElement{ coords: "1,2"; data: "2.98"; }
                    ListElement{ coords: "0,3"; data: "5.34"; }
                    ListElement{ coords: "1,3"; data: "4.54"; }
                    ListElement{ coords: "0,4"; data: "6.01"; }
                    ListElement{ coords: "1,4"; data: "5.83"; }
                }
                rowRole: "coords"
                columnRole: "coords"
                valueRole: "data"
                rowRolePattern: /(\d),(\d)/
                columnRolePattern: /(\d),(\d)/
                rowRoleReplace: "\\1"
                columnRoleReplace: "\\2"
            }

            Gradient {
                id: gradient
                GradientStop { position: 1.0; color: "#5000FF" }
                GradientStop { position: 0.0; color: "#2000FF" }
            }
        }
    }
}
// Copyright (C) 2026 The Qt Company Ltd.
// SPDX-License-Identifier: LicenseRef-Qt-Commercial OR BSD-3-Clause

import QtCore
import QtQuick
import QtQuick.Layouts
import QtQuick.Controls.Fusion
import QtQuick.Dialogs

Rectangle {
    id: mainView
    width: 1280
    height: 720
    color: Application.styleHints.colorScheme === Qt.Dark ? "darkgray" : "lightgray"

    property var item: stackLayout.itemAt(stackLayout.currentIndex)
    property var outputsize: Qt.size(linegraph.width * 4, linegraph.height * 4)

    RowLayout {
        id: rowLayout
        anchors.fill: parent
        anchors.leftMargin: 5
        anchors.rightMargin: 5
        anchors.topMargin: 5
        anchors.bottomMargin: 5
        spacing: 5

        GroupBox {
            id: groupBox
            Layout.alignment: Qt.AlignLeft | Qt.AlignTop
            title: qsTr("Printing and exporting")

            ColumnLayout {
                id: buttonLayout
                spacing: 0
                uniformCellSizes: true
                Button {
                    id: captureButton
                    text: qsTr("Save to PDF")
                    flat: true

                    icon.source: pressed ? "documents_fill.svg" : "documents.svg"
                    icon.height: 36
                    icon.width: 36

                    onPressed: dialog.open()
                }

                Button {
                    id: printButton
                    text: qsTr("Send to printer")
                    flat: true

                    icon.source: pressed ? "print_fill.svg" : "print.svg"
                    icon.height: 36
                    icon.width: 36

                    onPressed: printerDialog.open()
                }
            }
        }

        Item {
            id: tabGroup
            Layout.fillHeight: true
            Layout.fillWidth: true

            TabBar {
                id: tabBar
                anchors.left: parent.left
                anchors.right: parent.right

                TabButton {
                    text: "2D Graph"
                    implicitHeight: 48
                    icon.source: checked ? "flatten_square_fill.svg" : "flatten.svg"
                    icon.height: 36
                    icon.width: 36
                }

                TabButton {
                    text: "3D Graph"
                    implicitHeight: 48
                    icon.source: checked ? "box_left_fill.svg" : "box_left.svg"
                    icon.height: 36
                    icon.width: 36
                }
            }
            Frame {
                id: tabFrame
                anchors.left: parent.left
                anchors.right: parent.right
                anchors.top: tabBar.bottom
                anchors.bottom: parent.bottom

                StackLayout {
                    id: stackLayout

                    anchors.fill: parent
                    currentIndex: tabBar.currentIndex

                    Graph2D {
                        id: linegraph
                    }

                    Graph3D {
                        id: bargraph
                    }
                }
            }
        }
    }

    MessageDialog {
        id: message
        onButtonClicked: mainView.cleanAfterPrint()
    }

    FileDialog {
        id: dialog
        currentFolder: StandardPaths.writableLocation(StandardPaths.PicturesLocation)
        nameFilters: ["PDF files (*.pdf)"]
        defaultSuffix: "pdf"

        fileMode: FileDialog.SaveFile
        onAccepted: {
            mainView.prepareForPrint()

            mainView.item.grabToImage(function (result) {
                message.title = "Save PDF"
                message.text = "PDF saved to " + graphPrinter.generatePDF(
                            dialog.selectedFile, result.image)
                message.open()
            }, mainView.outputsize)
        }
    }

    Dialog {
        id: printerDialog
        anchors.centerIn: parent
        contentHeight: printerListView.height
        contentWidth: printerListView.width

        title: qsTr("Available Printers")
        modal: true

        onOpened: {
            printerModel.clear()
            var printers = graphPrinter.getPrinters()
            printers.forEach((x, i) => printerModel.append({
                                                               "name": x
                                                           }))
        }

        onAccepted: {
            var selectedPrinter = printerModel.get(printerListView.currentIndex)
            mainView.prepareForPrint()
            mainView.item.grabToImage(function (result) {
                message.title = "Print"
                message.text = graphPrinter.print(result.image,
                                                  selectedPrinter.name)
                message.open()
            }, mainView.outputsize)
        }

        onClosed: {
            mainView.cleanAfterPrint()
        }

        Component {
            id: printerDelegate
            Rectangle {
                width: 198
                height: 25
                color: "transparent"
                border.color: mainView.item.theme.grid.mainColor
                clip: true

                Text {
                    padding: 5
                    text: qsTr("<b>%1</b>").arg(name)
                    color: mainView.item.theme.labelTextColor
                }

                MouseArea {
                    anchors.fill: parent
                    onClicked: printerListView.currentIndex = index
                }
            }
        }

        contentItem: Rectangle {
            id: printerItem
            height: printerListView.height
            width: printerListView.width
            color: mainView.item.theme.plotAreaBackgroundColor

            ListView {
                id: printerListView
                height: 100
                width: 200
                clip: true

                model: printerModel
                delegate: printerDelegate
                highlight: Rectangle {
                    color: mainView.item.theme.grid.subColor
                }
            }
        }

        footer: DialogButtonBox {
            Button {
                text: "Print"
                DialogButtonBox.buttonRole: DialogButtonBox.AcceptRole
            }
            Button {
                text: "Cancel"
                DialogButtonBox.buttonRole: DialogButtonBox.RejectRole
            }
        }
    }

    ListModel {
        id: printerModel
    }

    function prepareForPrint() {
        if (stackLayout.currentIndex === 1) {
            var newsize = Qt.size(bargraph.width * 4, bargraph.height * 4)

            // check that we do not exceed maximum texture size
            if (newsize.width * Screen.devicePixelRatio > graphPrinter.maxTextureSize ) {
                // scale to 25% under max texture size to be on the safe side; some GPUs seem
                // to glitch when using the abosulute max
                var ratio = (newsize.width * Screen.devicePixelRatio * 1.25)
                        / graphPrinter.maxTextureSize
                newsize.width /= ratio
                newsize.height /= ratio
            }
            outputsize.width = Math.round(newsize.width)
            outputsize.height = Math.round(newsize.height)

            // resize the bar graph to match the PDF output size
            item.width = outputsize.width
            item.height = outputsize.height
        } else {
            outputsize = Qt.size(linegraph.width * 4, linegraph.height * 4)
        }
    }

    function cleanAfterPrint() {
        if (stackLayout.currentIndex === 1) {
            // resize the bar graph back to the actual visual size
            item.width = stackLayout.width
            item.height = stackLayout.height
        }
    }
}